ADX stands for Average Directional Index. It was initially designed in 1978 to be used to detect long-term trends in the stock market on a 1 day time frame. Now, it is frequently used with any time frame in any sector of the market represented on the Olymp Trade platform.
Contents
- What is the ADX Indicator and Where to Find It?
- How Do I Set the ADX Indicator?
- ADX Indicator Interpretation
- ADX Indicator Use Example
- ADX Indicator as a Trend Reversal Signal
- There is More on the Platform
Interact with the underlined words and green dots to get additional details and explanations.
What is the ADX Indicator and Where to Find It?
ADX stands for Average Directional Index. It was initially designed in 1978 to be used to detect long-term trends in the stock market on a 1 day time frame. Now, it is frequently used with any time frame in any sector of the market represented on the Olymp Trade platform.
Generally, there are two main types of various indicators available on the platform: trend indicators and oscillators. Visually, oscillators are frequently represented by a separate chart that corresponds to the price performance chart. The ADX indicator belongs to this second type.
Therefore, you’ll find the ADX Indicator in the oscillators section once you press the bottom left compass sign on the Olymp Trade platform. As you can see, it consists of three lines that go up and down in the section at the bottom of the screen.

How Do I Set the ADX Indicator?
Once you add the ADX Indicator to your chart, you can press on its name in the top-left corner of the graph to customize it.
Apart from changing the color of each of the three lines, you can set the number of periods. They are set to 14 by default, and most traders prefer to keep it this way. Others set it to 12, 18, 21, or a different number of periods, usually in a range from 7 to 30.

Typically, the higher the period number you set, the more long-term oriented your ADX Indicator will become. The lower the number of periods, the more sensitive to the momentary changes of the market it will be.
ADX Indicator Interpretation
The three lines of the indicator mean the following:
- The +DI line indicates the asset price increase.
- The -DI line indicates the asset price decrease.
- The ADX line is the indicator of the trend situation in the market, trend, or flat.
The range fluctuates between 0 and 100:
- An ADX value below 20 indicates that the trend is weak.
- An ADX value from 20 to 40 means that the trend is strong.
- An ADX value from 40 to 60 indicates a very powerful trend.
- ADX values higher than 60 ADX are extremely rare.
Here are some tips for interpreting the behavior of the ADX and DI lines:
- If there is an upward or downward trend in the market, the distance between the DI signal lines increases, and ADX goes up.
- Conversely, when there is less activity on the market, the distance between the DI signal lines shrinks, and the ADX drops.
- If the +DI line is above the others, it indicates an upward trend.
- However, if the -DI is above the others, it indicates a downward trend.
- If the +DI and -DI lines cross, it indicates a trend change.
ADX Indicator Use Example
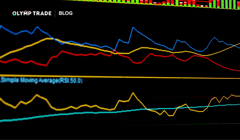
In the image below, the ADX line is red, and the DI lines are blue and brown.
On February 24 and 25, the FTSE 100 was at the bottom of 7,200 that later on resulted to be the beginning of a new uptrend. During that period, the red ADX line rose towards 51.259 while the DI lines were below.
That could have been interpreted as a very powerful trend starting.
On March 3 when the FTSE 100 was below 7,400, the red ADX line was down while the DI lines were both going up very close to each other. According to our interpretation method, that meant that the trend was weak.

ADX Indicator as a Trend Reversal Signal
Here is another approach to use the ADX Indicator in trading:
- If the +DI line crosses the -DI line bottom-up on the way upwards, that means that an upward reversal is coming. Therefore, it is a signal to prepare to open a buy trade.
- If the -DI line crosses the +DI bottom-up on the way upwards, that means that a downward reversal is coming. Therefore, it is a signal to prepare to open a sell trade.
There is More on the Platform
The ADX Indicator is one of many indicators available on the platform. Go check them out, and you’ll definitely find those that are most suitable for your trading style!
Risk warning: The content of the article does not constitute investment advice and you are solely responsible for your trading activity and/or trading results.