If you’re interested in trading company shares in the stock market, there is good news. has recently made a huge expansion of companies available on the platform for traders. New additions to Olymp Trade’s stock offers include Amazon, Alibaba, Exxon Mobil, and more.
There are now more than 30 different stocks to choose from on the Olymp Trade platform for long and short term investing. Whether you prefer Fixed Time Trading mode or the increasingly popular Forex mode, you can now utilize these uber-successful companies as a vehicle for trading profits.
Trading in stocks is one of the most stable ways to invest especially if care is given to the quality of the company when investing. Typically, long standing companies with good reputations and management will see their value rise consistently over time, which adds value to an investors’ portfolios.
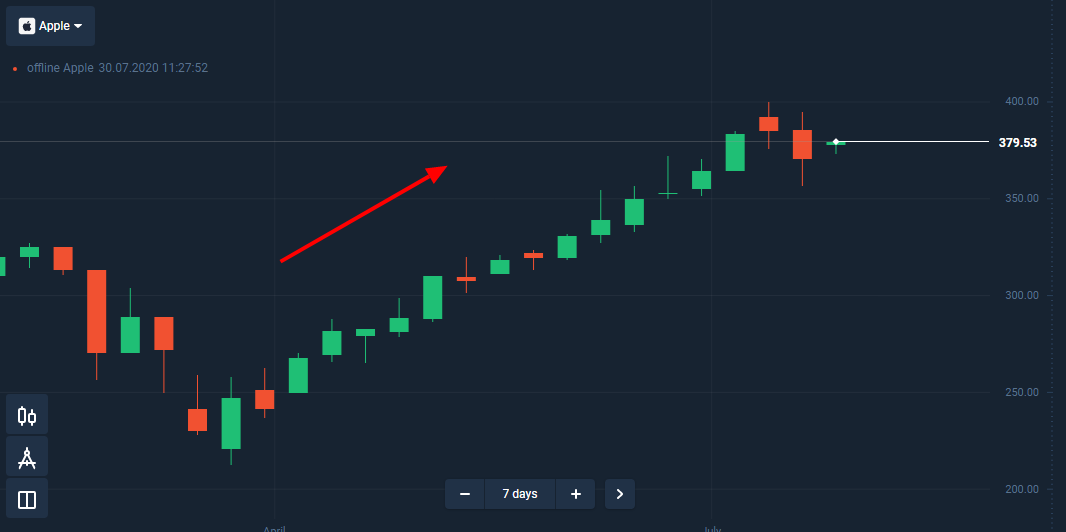
Traders can also make significant profits off short-term jumps and declines that are news driven or a reflection of the company’s profitability. This can be more difficult to understand, forecast, and measure if you’re new to trading in company shares (stocks).
To help get you up to speed on how you can make some great profits in stocks on Olymp Trade, here is a quick guide to get you started trading shares in some of the biggest and most high profile assets in the world.
We suggest you start by focusing on two different parameters when determining which stocks to trade and when to trade them: price trends and company profits.
Trading Price Trends
Science tells us that an object in motion tends to stay in motion and stock prices tend to behave in a similar fashion. This idea forms the basis for the advice given to nearly all new investors to “trade with the trend, the trend is your friend.”
There are dozens of ways to approach trend trading and an infinite number of variations on these strategies as well, but here is a simple approach that you can use almost immediately and will pay out in good profits most of the time by using moving averages.
To do this, we are going to combine two types of moving averages: the simple moving average (SMA) and the exponential moving average (EMA) to help us identify a trend and to forecast a change in trend that will help you maximize your profits on a trend.
The Olymp Trade platform has all the tools necessary to set up your chart to use this trend strategy. The screenshot below shows where the indicator button is (red arrow) and the SMA and EMA are at the top of the list.
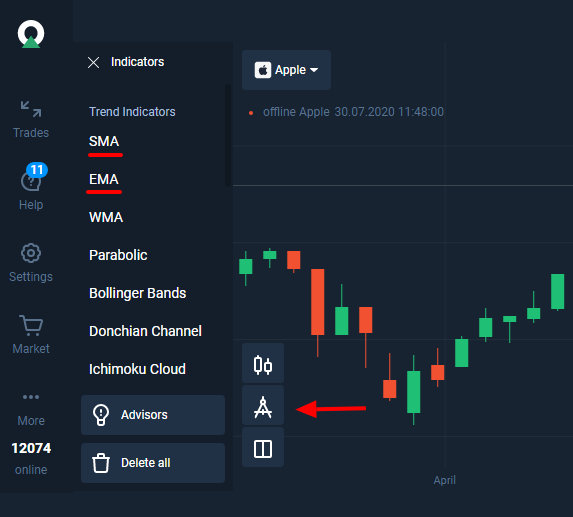
Start by selecting the SMA indicator and you will see a line appear on your chart. Our SMA indicator is going to be our long-term average so change the color to red and set the number to 55 which will be our timeframe. You can do this by clicking on the small “pencil” icon next to the indicator on the chart.
Repeat this process for the EMA using a blue line and a period of 20. The EMA will serve as our short-term trend indicator. The screenshot below shows how to set up the indicator and you will see how the lines are displayed for the Facebook stock chart, which is set to 1 day.
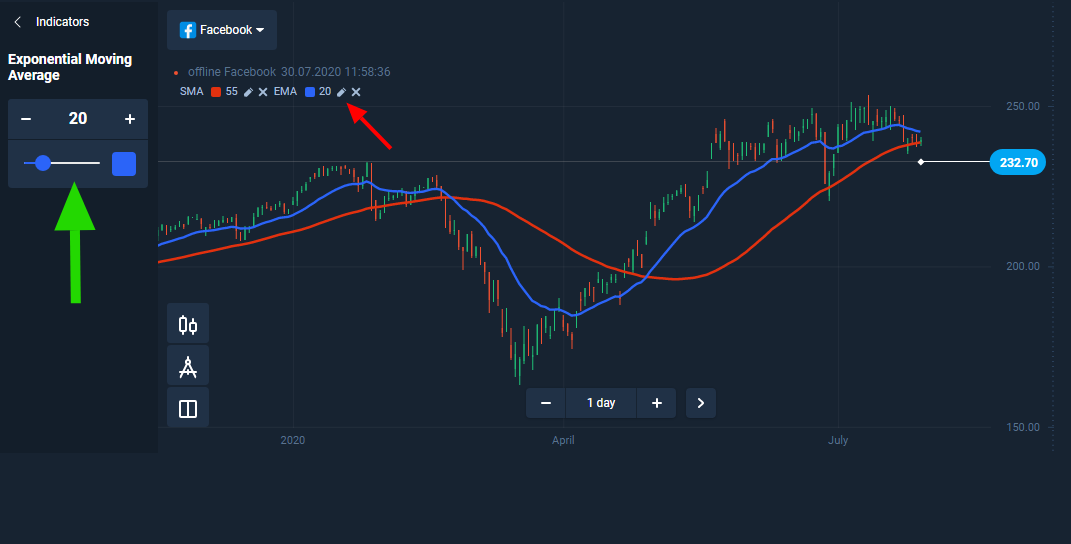
Now our trend chart for Facebook is all set up and we can see that the price has been steadily increasing since April. However, the two trend lines are starting to get much closer meaning that a reversal of the trend may occur in the near future.
Ideally, when trading the trend, you will want to find points where the short-term trend (blue line) passes through the long-term trend (red line) in the opposite direction. When this occurs, there is a strong possibility that the trend is reversing and you can open an Up or Down position accordingly.
If you look back at the Facebook chart, you will see that trend reversals occurred at the end of February of this year and at the end of May.
In both cases, opening positions when the blue line crossed the red line would have provided significant profit provided a trader exited the positions before the trend reversed again.
You can duplicate this trend strategy for any stock and for any time frame, but for blue-chip stocks, it isn’t recommended to do this in extremely short periods of time like 15 minutes unless you are using a “scalping” strategy, which is a little more advanced.
Share in the Earnings on Profitable Companies
The value of shares of a company’s stock is most heavily influenced by its profitability. There are exceptions to this rule but most of those are based on the speculation that those companies will become extremely profitable in the future — see Facebook and Tesla for examples (both are available to trade on Olymp Trade).
However, generally speaking, if a company continues to earn profits, which are then distributed to their shareholders, then the stock price of that company will continue to rise. For longterm investors, this is important because they not only want their share of the profits regularly, but they want to be able to sell their stock at a profit at some point in time.
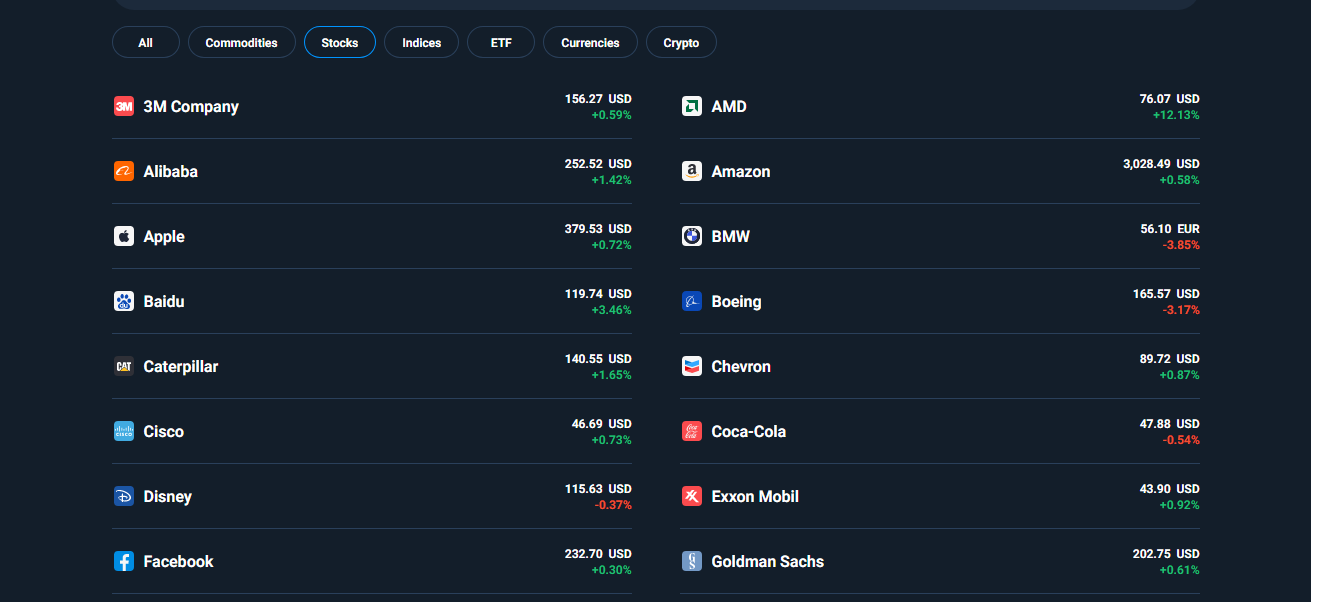
Therefore, it is highly recommended to only trade the stocks of profitable companies because there is much less risk involved, and there is continued upside potential. The key issue about trading these stocks is then to understand their actual value.
Luckily, these companies are publicly traded so they are required to report profits and announce how much they will pay in dividends to each shareholder. They do this every quarter and you can see when these announcements will be made in any economic calendar.
Here are some key figures to look at to determine how profitable a company truly is and how valuable their stock is in reality. You can find nearly all these numbers online at a company’s website or from market news organizations.
1. Earnings Per Share (EPS) — In a simple company, if there was $100 in profit and 100 shares of stock, each shareholder of 1 share of stock would receive $1. Unfortunately, this isn’t how it works with large blue-chip companies where there are various forms of stock including what are called “preferred stock” or “premium shares”.
Therefore, the actual EPS is the amount of profit after “preferred dividends” have been paid divided by the amount of remaining shares.
2. Price to Earnings Ratio (P/E Ratio) — This figure shows the current price of the stock divided by the last 12 months earnings. It is also known as the “trailing P/E”. Alternatively, the current stock price divided by estimated profits for the next 12 months is called the “forward P/E”.
How do you know if the company’s P/E is good? There is no easy answer here as a high P/E may indicate a stock is overpriced and may have peaked and a low P/E might indicate poor prospects for the future.
However, we can understand with some certainty what the value of the company is right now and that will help in determining a forecast and strategy on investing.
3. Debt-Equity Ratio (D/E) — This figure shows, in general, how much debt a company has in relation to the total value of all the shares of stock. A high D/E can indicate that the company is financing expansion and development with large loans and/or its stock value isn’t keeping pace with existing loans.
This is one of the main tools that a bank looks at before loaning a person or company money so you will want to do the same before investing your money in companies with a poor D/E.
4. Return on Equity (ROE) — This figure shows investors how well the company management is doing in generating profits in relation to the amount of money that has been invested. The calculation is as follows: Net income minus preferred dividends divided by shareholder equity (value of shares).
Generally speaking, if the ROE is less than 10%, it is considered “poor” by most analyst standards. 14% is about the average for S&P 500 companies so anything at that point or above would be positive.
To use these numbers in making decisions can be a lot less complicated than understanding all the factors that lead calculating the numbers themselves.
For long term investors, companies that display good EPS, P/E ratios, D/E, and ROE make solid choices for buying the upside. Of course, the profits on Contracts for Difference (CFDs) as used on Olymp Trade may take longer to develop.
However with Olymp Trade’s low rollover commissions (overnight fees) and the use of multipliers, investors can take a relatively safe path in reaching significant profits.
For short-term investors, understanding these parameters will help you identify some Up and Down opportunities to open positions. For example, when a company’s EPS comes in lower than what was forecasted, the stock will often drop for a short period of time.
This means a trader can take a Down position after the announcement, close the position with some profit and then take an Up position to make money on the “bounce” since blue-chip stocks nearly always trend upward in the long run.
Trading in Stocks isn’t Just for Rich People
Using your newfound knowledge on stocks and matching that with a trading platform that gives you the professional tools to succeed like Olymp Trade, you can transform a modest investment into a comfortable living or substantial retirement.
The key is to take advantage of the resources you have available to you and continue to develop your trading skills as you go. Of course, none of that matters without a platform that gives you access to all the major markets and premium assets.
Fortunately, Olymp Trade provides the access along with all the resources you need and training in developing your skills. The only thing left to do is join the “rich” people that are already trading these stocks and other high profile assets.


