This Expert Review covers the week from 06.06.2022 to 12.06.2022.

In this digest, we will discuss how different markets are responding to the inflation and recession worries as the Russia-Ukraine conflict continues.
Contents:
Interact with the underlined words and green dots to get additional details and explanations.
Gains on
Hundred-dollar Trades
Amazon ↑9.55%
$191 gained on an x20 Up trade
AUD/JPY ↑3.81%
$1,905 gained on an x500 Up trade
GBP/AUD ↓2.07%
$1,035 gained on an x500 Down trade
Overview
Forex
EUR and JPY rose on Thursday, June 2, partly reversing the recent losses against USD. CHF hit a one-month high against EUR after Swiss inflation surged to a 14-year high. AUD fluctuated in May, and the global growth concerns will likely keep undermining its strength.
Stocks
The trading session on Wednesday, June 1, started with optimism in the stock market. However, the major averages slipped later despite solid readings in the US manufacturing sector. The S&P 500 was down 0.7%, the Dow lost 0.5%, and the Nasdaq was down 0.7%. Data from the Institute for Supply Management showed the US manufacturing sector grew faster than expected in May. That may mean that fears of a downturn in the US economy may be exaggerated. Salesforce shares were up more than 8% in pre-market trading Thursday, June 2, after the software maker’s upbeat first-quarter report.
Commodities
In the energy market, prices will likely stay high as the European Union agreed to ban 90% of Russian oil by the end of the year, and Russia cut off gas supplies to Denmark and the Netherlands.
Crypto
Bitcoin broke above $32,000 but lost the bullish momentum as risk aversion pressed on.
Forex
USD/JPY
USD/JPY was Pressured Upward by USD
Primary next-day price movement expectation: Down to 129.00
Secondary next-day price movement expectation: Up to 130.80

For JPY, May was a month of gains, but June started under pressure. Fresh gains in US Treasury yields and a dovish statement from the Bank of Japan (BoJ) made the USD/JPY pair surge.
The Daily chart above shows how USD/JPY initially went up as JPY was pressured by USD. Later, it dropped following the main bullish impulse. We believe USD/JPY can make new highs on a multi-month scale as the trend outlook really depends on the US and global sentiment. We do not rule out further strengthening of USD. However, given the deep overbought conditions, the pace of increase on the price for the USD/JPY pair will likely slow down. Therefore, a confident breakout of the next major resistance level of 130.50 is unlikely. On the downside, crossing the level of 129.30 would indicate that the current upward pressure has eased. The next resistance levels are 130.50 and 130.80. Overall, only the breaking of the 129.00 level may suggest that the rapid increase in momentum has failed.
EUR/GBP
EUR/GBP has been Steadily Rising
Primary next-day price movement expectation: Up to 0.8656
Secondary next-day price movement expectation: Down to 0.8436

Market observers are looking forward to the Eurozone inflation data. It is expected to rise to a year-on-year record high of 7.7% in May, up from 7.4% in April. Inflation in both Germany and Spain jumped above expectations to 7.9% and 8.7%, respectively. The data comes as the ECB adopted a more hawkish stance towards monetary policy last week with a 25 basis point rate hike now expected in July and September.
EUR/GBP has been steadily rising over the past week. The 20-day Simple Moving Average (SMA) held the price movement down. Hence, it held on to its latest rebound in the main 200-day SMA at the level of 0.8440. In the meantime, a bullish crossover between the 20-SMA and 200-SMA supports further trend improvement. The 50-day SMA drives the Golden Cross as well. Thus, one can expect EUR/GBP to keep growing so keep an eye on this currency pair next week.
On the upside, we expect the pair to meet no major resistance until it reaches the key area of 0.8594. If the Uptrend breaks that level, it may keep going up towards the next major barrier at 0.8656. If the downtrend breaks control below the 20-day SMA and the 0.8500 level, the price may seek shelter somewhere between a flat 200-day SMA and 50-day SMA, both converging at 0.8436.
Stocks
Salesforce
Salesforce Saw Its Best Day Since August 2020 After Raising Its Full-year Profit Forecast
Primary next-day price movement expectation: Up to 191.21
Secondary next-day price movement expectation: Down to 166.15

Salesforce shares were up more than 8% in pre-market trading the morning after the enterprise software-maker reported first-quarter financial results that topped analysts estimates. Salesforce boosted its full fiscal-year adjusted earnings guidance to between $4.74 and $4.76 per share, which is better than the EPS of $4.65 as previously expected.
We believe Salesforce shares will move back towards the level of 184.94. If that price level is broken, it is possible that the price will head towards the level of 191.21. The latter is also an important level that was tested in March and April. The downward movement may head towards the level of 166.15.
Apple
Apple Stock Up Over Potential WWDC Announcements
Primary next-day price movement expectation: Down to 142.74.
Secondary next-day price movement expectation: Up to 155.00.

Apple shares rose ahead of the WorldWide Developers Conference scheduled for June 3. The company is expected to share a major update on its hardware and software lineup. Also, it appears that it has been preparing for a launch of a new MacBook Air before but faced supply chain issues because of the Covid-19-related shutdown in China. Over the last ten years, Apple has only lost value once, in the summer 2020. That year, the company had it’s maximum loss for all time.
In recent weeks, Apple stock has been trading below its 50-day and 200-day Moving Averages. The iPhone maker is working on a consolidation at 183.04. On the daily chart above, the 50-SMA and 200-SMA appear to start forming a top-to-bottom crossing. If the price breaks through the support level of 145.00, it will likely drop towards 142.74. Conversely, if the price moves up, it will likely target the level of 155.00.
Commodities
Brent
EU Embargoes Russian Oil
Primary price movement expectation: Up to 120.356
Secondary price movement expectation: Down to 114.432

Last week, on May 30, the European Union met for a lengthy discussion on the sixth package of sanctions and an oil embargo against Russia. The 27-state bloc agreed on a phased out ban of 90% of Russian oil by the end of the year. The remaining 10% will go to the main opponent of the embargo, Hungary, along with the Czech Republic and Slovakia. These countries will keep receiving Russian oil via pipeline as they cannot easily find alternative providers.
Additionally, China's biggest city and financial hub, Shanghai, finally lifted lockdown measures on Wednesday, June 1. With all manufacturers restarting their activities as of June, oil demand will most likely increase in a tightening market.
On Tuesday, March 31, the price of Brent rose above $120, which is the highest level since the end of March. However, the price recovered later in the week after OPEC+ countries Saudi Arabia and the United Arab Emirates announced that they were ready to increase production to replace Russian exports and attempt to lower prices. We expect that the price of Brent oil will remain at elevated levels with the support levels around $114 and $110 with resistance levels at $120 and the March high of $127.
Natural Gas
More EU Cutoffs for Natural Gas
Primary price movement expectation: Up to 9.430
Secondary price movement expectation: Down to 8.122

Last week, Russia cut off Natural Gas supplies to two more countries in the European Union, Denmark and Netherlands. Previously, gas supplies were turned off for Bulgaria, Poland, and Finland. This is a repercussion for the five countries as they refused to pay for Russian natural gas in Russian rubles.
In the meantime, the price of natural gas briefly dropped to 8.122 MMBTU because no more cut-offs are expected. All EU supply chains have either paid as per the new terms or have been cut off. That helped the price quickly recover. Therefore, we expect it to stay at elevated levels. We believe the price is following the support uptrend line with resistance around 9.430 and support at 8.122 MMBTU.
Gold
USD Strength Puts Pressure on Gold
Primary price movement expectation: Down to 1836.195
Secondary price movement expectation: Up to 1868.200 – 1892.540
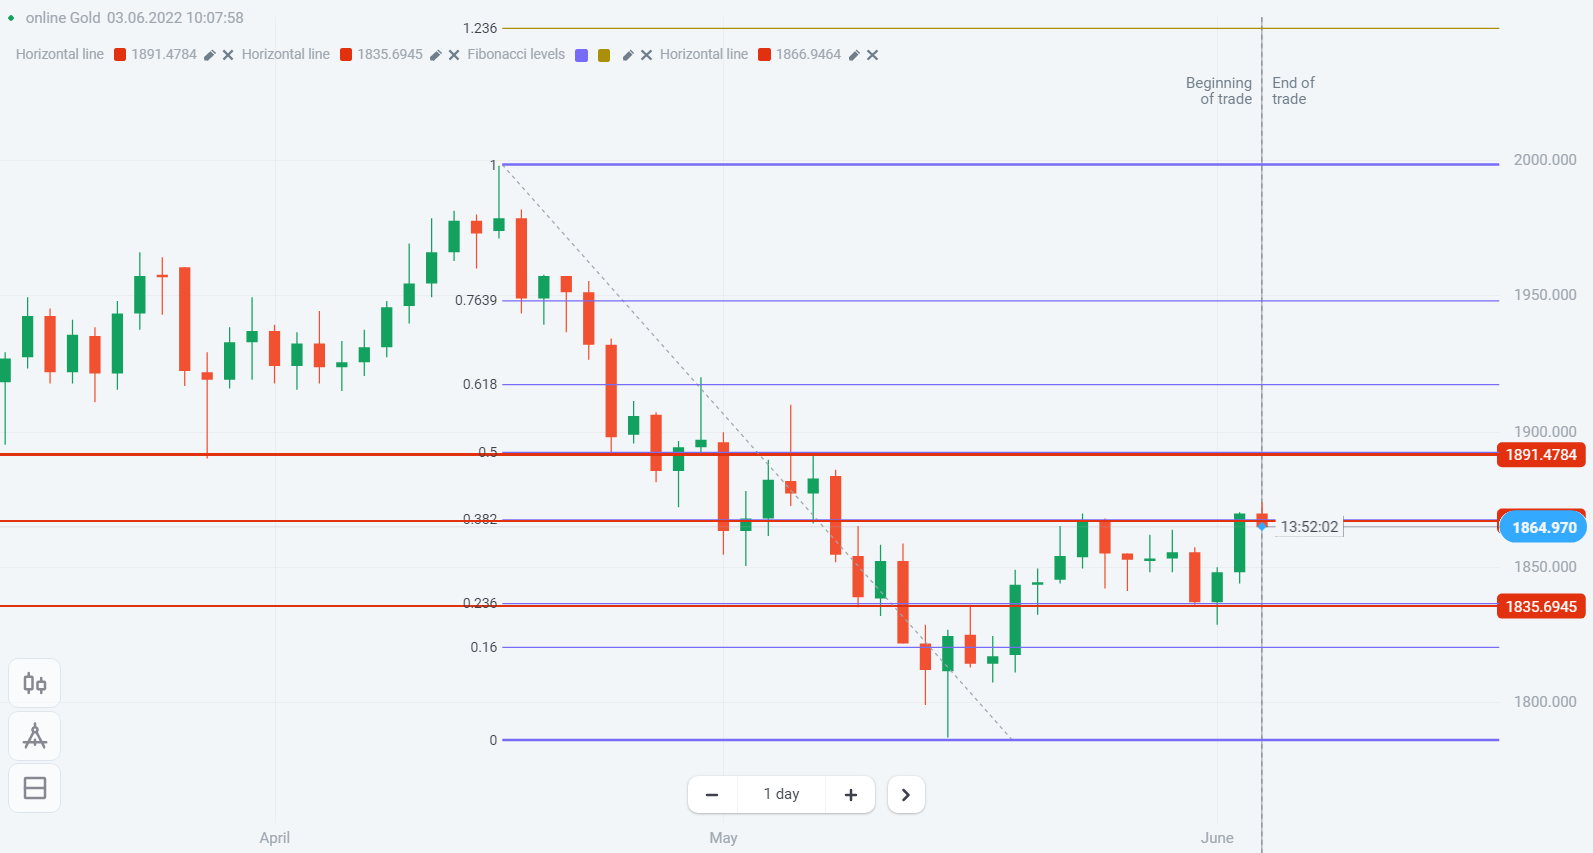
The gold price has been range-bound for the past two weeks following a strong downtrend from April 18. It stays under pressure due to the strengthening of USD. The United States package of interest rate hikes to fight inflation is one of the main contributing factors.
On the daily chart above, the price touched the 38.2% Fibonacci level as the resistance level at 1868.200 and 23.6% as the support level at 1836.195. If USD continues to strengthen, we may see the price of gold fall to 1820.00.
Crypto
Bitcoin
Bitcoin Failed to Keep Bullish Momentum
Primary price movement expectation: Down to 28277.725
Secondary price movement expectation: Up to 30971.970

Last week, Bitcoin finally broke out of a narrow range and closed above $30,000 for the first time since Mid-May. On May 31, the price reached as high as $32394.493. Mainly, that was a result of traders taking advantage of the generally low price level and confidence related to the easing of lockdown measures in China. However, BTC could not uphold the uptrend momentum as traders collected their short-term profits. Risk aversion remains as inflation and recession is still worrying, and the conflict between Russia and Ukraine continues.
On the chart above, the downtrend line serves as resistance. Last week, the price formed an evening star price pattern. In the near term, we expect downside potential and range-bound trading. Support is around 28,277.725, and resistance is in the vicinity of 30,000.
Risk warning: The content of the article does not constitute investment advice and you are solely responsible for your trading activity and/or trading results.