Oscillator indicators are standard tools to determine the market context for Forex derivative traders, Stocks derivative traders, Crypto derivative traders etc. Oscillator trading helps investors define the exact entry/exit points of a trade. As a result, professional traders use oscillators in conducting technical analysis while making trading decisions.
However, there are several types of oscillators in financial instrument trading including measuring momentum, volatility, strength, and trend. This article will introduce you to oscillator trading, how to use oscillators effectively, and how to generate the best trading ideas.
Contents:
- What Are Oscillator Indicators?
- How to Use Oscillators in Technical Analysis
- Oscillator Trading in FTT & Stocks on Olymp Trade
- Final Thoughts
Interact with the underlined words and green dots to get additional details and explanations.
What Are Oscillator Indicators?
You can group Forex oscillators in the momentum indicators group. Financial investors use oscillators in technical analysis more often to determine the market context appropriately. You can use these oscillators in technical analysis to determine the momentum, strength, current trend, breakouts, and more.
Oscillator indicators commonly have a feature of dynamic signal lines that may fluctuate within specific levels to declare overbought and oversold levels. The most common Forex oscillators are the Relative Strength Index (RSI), Commodity Channel Index (CCI), Stochastic, and Moving Average Convergence Divergence (MACD).
How to Use Oscillators in Technical Analysis
This part will describe the most efficient ways to use Forex oscillators. Different oscillator indicators involve different formulas and elements, and some readings in price charts and oscillator indicators may show results in an independent window.
When to Open Long Positions
Traders can use oscillator indicators to determine bullish momentum and open a long position at the right time. One of the most popular Forex oscillators is the Moving Average Convergence Divergence (MACD), which also acts as a trend indicator. Here, we'll focus on its function as an oscillator. If you're interested in studying more about MACD, explore this article.
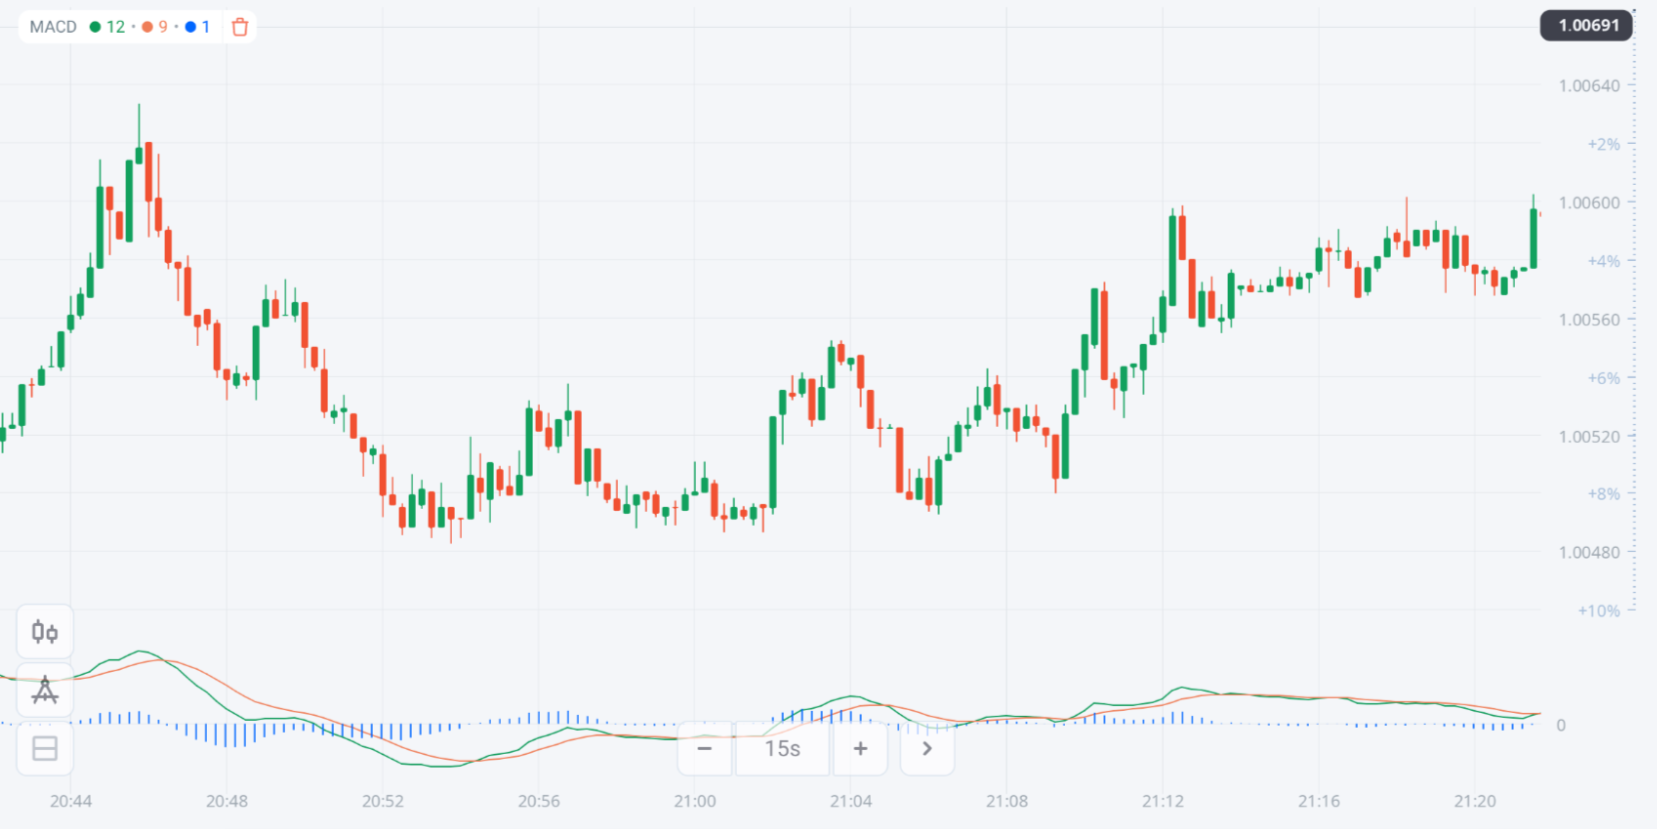
The MACD histogram helps traders to identify the momentum of the price changes.
When the bars cross the zero level, the price increases, and traders open an Up trade.
Here is how it looks on the chart:

How can we forecast this moment of the price going up? ![]() Look at the histogram again.
Look at the histogram again.
When you see that the histogram is below its zero level but is gradually rising while the price is falling, that's the preliminary signal for the upcoming rise in price. At this moment, be ready to open an Up trade.

When to Open Short Positions
Oscillator indicators are useful tools for detecting the initial phase of bearish momentum. For example, the RSI indicator can be used to execute successful short trades. The RSI indicator results in an independent window containing a dynamic line that moves within a specific range of 0-100.

The RSI dynamic line fluctuates at three levels, declaring different forces on the asset price. The dynamic line moves above the 70% level when the price movement reaches an overbought condition.
Investors expect an upcoming bearish pressure when the RSI line stays above the top level.
However, the dynamic line can remain at that level while the bullish pressure remains intact. The dynamic line starts to decline below the upper (70) level and reaches below the central (50) level with sufficient declining pressure on the asset price. On the other hand, when the line moves below the bottom 30% level, it indicates the price has entered an oversold condition. Expert investors often seek a bullish reversal at this point.
Detecting a Sideways Trend Using a Forex Oscillator
Oscillator indicators are adequate to detect sideways as well. For instance, the Stochastic indicator can detect sideways trends alongside bullish and bearish momentum and trends. The Stochastic oscillator is displayed in an independent window containing two dynamic signal lines that fluctuate within a range of 0-100.

Detecting sideways trends is essential as it declares corrective market conditions. The price movement is slow, or the trend loses strength in this phase. It is common in the Forex market that prices move sideways just before a large increase or decrease in prices or before any significant news releases.
When both dynamic lines reach below the bottom level (20), the price may enter an oversold condition and above the top level (80) declares rapid buy pressure on the asset price.
Meanwhile, both dynamic lines frequently cross and move sideways, declaring the consolidation phase.
Combining Other Technical Concepts with an Oscillator Indicator
Expert financial investors often combine two or more technical indicators to determine more accurate trading positions. So of course, you can combine oscillator indicators with other technical tools or indicators for more efficiency. For example, you can use the Parabolic SAR indicator alongside the RSI indicator as a supportive indicator and combine both indicators' readings to generate trading ideas.
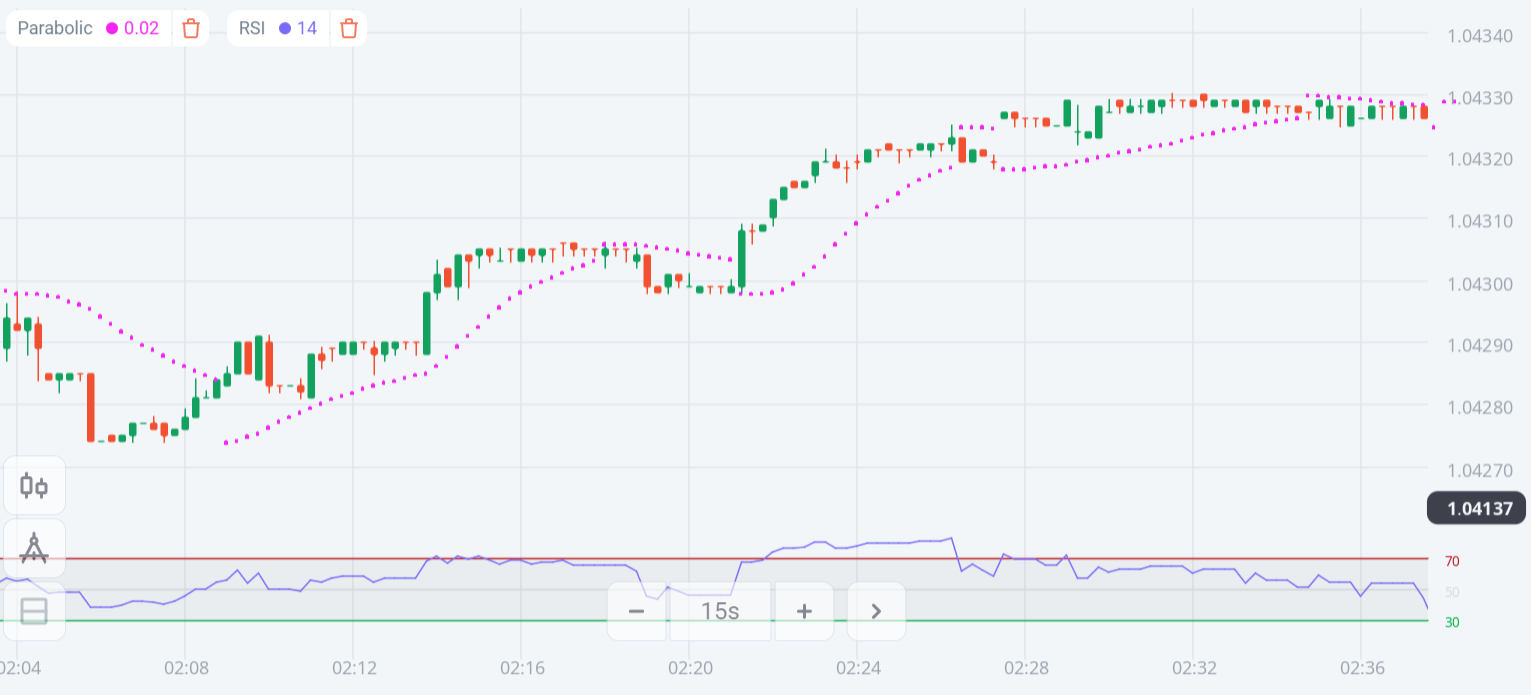
Suppose the RSI dynamic line starts to move upward from the bottom level and reaches near the central line. Meanwhile, the parabolic SAR indicator creates a series of parabolic dots that appear below price candles, declaring bullish pressure on the asset price.
The exact opposite scenario occurs when the price movement initiates a bearish momentum. The RSI line starts to decline, and parabolic dots flip to the upside of price candles, declaring sell pressure on the asset price.
Oscillator Trading in FTT & Stocks on Olymp Trade
Apart from using oscillators for Forex trading, Olymp Trade users can use this technique in FTT and Stocks regimes.
In FTT trading, traders speculate what direction the price will go after a chosen period of time. If successful, traders will receive their initial investment and a fixed payout. If unsuccessful, traders will lose the stake and miss the fixed payout.
Oscillators in a stock market offer to find strong market trends in FTT trading.
For example, if the RSI moves above the 70 level, the price is overbought. Similarly, if the RSI moves below the 30 level, it shows an oversold condition.
Therefore, in FTT trading, investors can open an Up position when the RSI returns higher from the oversold zone and a Down position when the RSI moves lower from the overbought position.

In Stock trading, the same theory is applicable. A suitable buy position comes when the RSI shows a rebound from the overbought 30 level.

Final Thoughts
Oscillator indicators are straightforward, and anyone with some basic understanding can use these tools in almost any trading instrument chart. You can also detect breakout levels using these tools alongside determining trends, momentum, and strengths. We suggest sufficient practicing before using this oscillator concept in live trading, as mastering the concept before applying it will help you use it more effectively and increase profitability.
There are enormous educational resources in the Olymp Trade Blog section for investors to learn about various trading tools and indicators to make their trading journey fruitful.
Try it on DemoRisk warning: The contents of this article do not constitute investment advice, and you bear sole responsibility for your trading activity and/or trading results.