This article reviews the most commonly used technical analysis patterns that will be useful for both beginners and advanced traders. Among them, you will find Bullish and Bearish Engulfing, Piercing and Dark Cloud, and Doji patterns. Very frequently, basic candlestick patterns are focused on trend reversals because these are very visible and hence, easily identified on the chart. Also, many oscillators and trend indicators help identify and forecast them. That’s why trading on trend reversals may be one of the most effective trading strategies if you combine it with technical indicators and trading on resistance and support levels.
Contents:
Interact with the underlined words and green dots to get additional details and explanations.
Bullish and Bearish Engulfing
In the image below, the green candle’s body covers that of the previous red one. A confident uptrend follows. That is bullish engulfing. The pattern is named as such because the bulls “engulf” the market which visibly appears as a sudden large green candle, or a number of them.
In this scenario, we would open an Up trade after the second green candle is formed.

Bearish engulfing follows a similar logic but in reverse.

In the above image, a large red candlestick’s body covers the previous green one’s.
We would open a Down trade after the second red candle as the price would eventually go down.
When a large green candle’s body covers the body of the previous red candle, it is a bullish engulfing pattern that suggests opening an Up trade.
When a large red candle’s body covers the body of the previous green candle, it is a bearish engulfing pattern that suggests opening a Down trade.
To help you better understand the patterns, we’ve made a helpful Youtube video guide for you about them. It explains Bullish and Bearish Engulfing, Piercing and Dark Clouds, other patterns, provides lots of useful trading tips related to them, and shows how you can use them live. Check it out!
Doji
Doji is a specific case of a candlestick with a very thin body and a long shadow. As a candlestick reflects the difference between the opening and closing price in a given period, a thin body reflects the fact that those two prices happened to be equal or almost equal.
Therefore, they essentially indicate the momentary balance between the buyers and sellers in the market. Also, they may come as a trend change signal as on the chart below.
A pretty consistent downtrend stopped with a Doji and changed to a strong uptrend after this candlestick formation.

A doji is a very interesting chart formation and comes in various types such as the Long-legged, Dragonfly, Gravestone, and Four-price Doji.
Piercing and Dark Cloud Patterns
A Piercing pattern is when, after a red candlestick appears, a green candlestick appears that closes higher than the red one’s middle.
That often brings a new uptrend and suggests opening an Up trade as the image below shows.

A Dark Cloud pattern is when, after a green candlestick appears, a red candlestick appears that closes higher than the green one’s middle.
That often brings a new downtrend and suggests opening an Down trade as the image below shows.

Pin Bar
A Pin bar is a candlestick formation that often looks like a hammer looking up or down. It features a thin body and a comparably long shadow in any direction.
Regardless of its color, it often brings a trend change that follows as the chart below shows.
In this particular example, we would open a Down trade after a second red candlestick to make sure we are not mistaken with a new downtrend.
Often, Pin Bar candlestick formations are used in combination with support and resistance levels. If there is a reversal away from the direction of the resistance or support level, and a Pin Bar is formed, such a case is called a True Pin Bar.

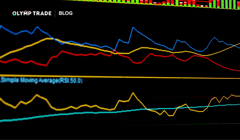
Combine with Oscillators
While observing trends is best combined with oscillators, there are various indicators available on Olymp Trade. Check them out, use them in combination with the above suggested candlestick patterns, and improve your trading! Also, check the Help Center for these and other patterns.
Trade NowRisk warning: The contents of this article do not constitute investment advice, and you bear sole responsibility for your trading activity and/or trading results.