
Reading price charts and making corresponding trade decisions is the essence of technical analysis. Mostly, it relies on a set of a few simple patterns. Observing them in combination across various timeframes, traders can reach a higher probability of correct price direction forecasts. This article presents the most commonly used chart patterns and shares a few tips on how to best do that.
Contents
- Choosing a Chart Type
- What Time Frame to Use
- Technical Analysis Chart Patterns
- When to Act on a Chart Pattern
- Use the Help Center
Interact with the underlined words and green dots to get additional details and explanations.
Choosing a Chart Type
The Olymp Trade platform offers various chart types. Among them, Japanese candlesticks are probably the most easy-to-read and are reflective of the market price dynamics. That’s why we suggest using this type for trading unless you are already accustomed to other chart types. For the same reason, we will be reviewing the patterns applicable to the Japanese candlestick chart.
What Time Frame to Use
Large time frame signals are usually considered more reliable. That doesn’t mean that the same patterns are more often correct over the long term than in the short term. Rather, it reflects the fact that long-term patterns grant more time for thorough examination which logically leads to higher chances of correct forecasts.
However, the relatively better reliability of large time frame patterns doesn’t mean that you have to only use 4h or 1d. Rather, use a combination of time frames to cross check your pattern observations. For example, for long-term strategies, 4h, 1d, and 7d time frames can make a good set. Whereas, 30m, 1h, and 4h will do fine for the mid-term. For short-term trading, 1h and smaller time frames together can provide a good market perspective.
Technical Analysis Chart Patterns
Trend Reversal Patterns
Trend reversals may be good moments to enter the market.
Identifying a coming trend reversal is key to technical analysis.
That’s why trend reversal chart patterns are widely known. Here are some of the most common:
Pin Bar (Reversal in Any Direction)
A short candle with a long shadow appears after a long opposite trend.

The color of the candlestick doesn’t matter. Whether it is red or green, it often precedes a trend reversal and may be taken as a signal for that.
Piercing Cloud (Upward Reversal)
A short red candle is followed by a larger green one that has a slightly lower low and a notably higher high.

Once the second candle is formed, a new uptrend may form.
Dark Cloud Cover (Downward Reversal)
A short red candle after a larger green one that has a slightly higher high and low.

Once the second candle is formed, prepare for a downtrend.
Bullish Engulfing (Upward Reversal)
After a downtrend or a series of red candles, a green candle appears with its body length covering the previous candle’s body.

This formation frequently precedes uptrends.
Bearish Engulfing (Downward Reversal)
After an uptrend or a series of green candles, a red candle appears with its body length covering the previous candle’s body.

This chart formation often foreshadows downtrends.
Head and Shoulders (Downward Reversal)
- The left shoulder is formed by an upswing followed by an equal drop.
- The head is formed by a long-term uptrend that peaks notably higher than the left shoulder and is followed by a full reversal down to the base level.
- The right shoulder is formed by another uptrend that starts at the base of the head and is followed by an equal drop.

As this chart pattern often precedes downward reversals, prepare to sell.
Inverted Head and Shoulders (Upward Reversal)
- The left shoulder is formed by a downswing followed by an equal rise.
- The head is formed by a long-term downtrend that dives notably lower than the left shoulder and is followed by a full reversal up to the base level.
- The right shoulder is formed by another downtrend that starts at the base of the head and is followed by an equal rise.
This pattern is frequently observed before upward reversals. Once you see it, prepare to buy.
Triple Bottom (Upward Reversal)
The price gets deflected by the resistance level twice, forming three bottoms at approximately the same level. After the price breaks the resistance level, a new uptrend is formed.

The recommendation here is to buy after the price breaks the resistance.
Triple Top (Downward Reversal)
The price bounces from the support level twice, forming three tops at approximately the same level. After the price breaks the support level, a new downtrend is formed.

With this chart pattern, it is best to sell after the support is broken.
Double Bottom (Upward Reversal)
The price makes a W-shape formation as it tries to break the resistance level. Once it does, a new uptrend is formed.

This chart pattern works similarly to the Triple Bottom.
Double Top (Downward Reversal)
The price makes an inverted W shaped formation as it tries to break the support level. Once it does, a new downtrend is formed.

The best way to act on this pattern is similar to the Triple Top. Sell after the price crosses the support level downwards.
Triangle Patterns
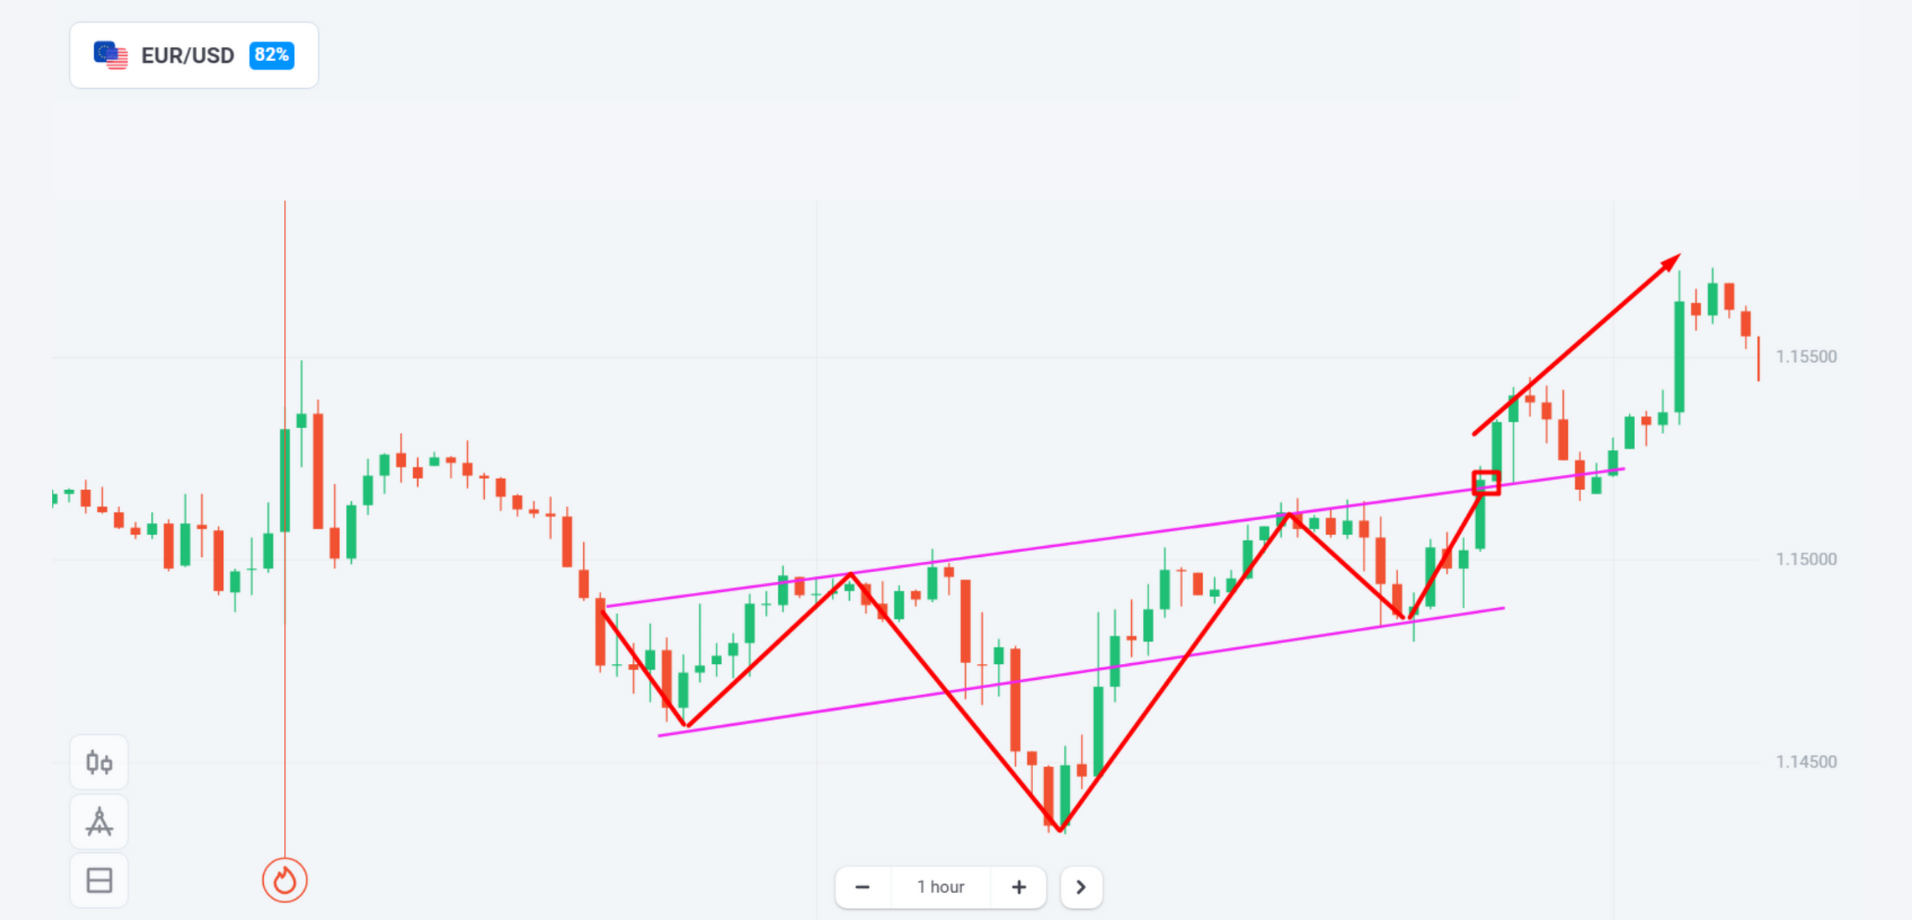
Ascending Triangle (Precedes an Uptrend)
While the same level highs form the upside of the triangle, higher lows form the upward inclined lower side.

Usually, the triangle is followed by the resistance level breakout. Therefore, you may want to buy before the breakout and sell after, but it’s better to wait till the breakout occurs and buy when the price breaks the line.
Descending Triangle (Precedes a Downtrend)
While the same level lows form the downside of the triangle, lower highs form the downward inclined upper side.

As this pattern is commonly followed by the support level breakout, you’ll sell when you see that the pattern is fully completed after the breakout.
Channel Patterns
Ascending Channel (Uptrend)
The local peaks of the uptrend fall into a line which forms the upper side of the channel. The local lows of the uptrend fall into a line which forms the lower side of the channel. Both sides move in parallel.

Descending Channel (Downtrend)
The local peaks of the downtrend fall into a line which forms the upper side of the channel. The local lows of the downtrend fall into a line which forms the lower side of the channel. Both sides move in parallel.

Flat (Sideways Movement)
Highs and lows form the horizontally parallel support and resistance levels that keep the price movement within a range.

The easiest way to trade all three chart patterns is to sell at the highs that are expected to fall into the channel’s upside and sell at the lows that fall into the downside. The tactic is based on the expectation that the channel keeps going for a while after you spot it.
Doji
A Doji is a chart formation that is widely used due to the ease of spotting it. It’s a single candle pattern, and it may come as both a green or a red candle. It features a very thin body and long shadows.

Usually, it means that the bullish and bearish momentums in the market are equal. In other words, it indicates the market’s indecisiveness.
After this pattern, you may see trend reversals, market consolidation, or other price movements. As there is too much uncertainty about what comes next, our usual recommendation is to close your positions on the corresponding instrument in this case.
When to Act on a Chart Pattern
Rushing into trading after observing a technical pattern is one of the most common trading mistakes. Whichever chart pattern you use, make sure you see it complete before you open or close a transaction.
For example, in a three-candlestick pattern, it is important for the third candlestick to complete itself. With the trend reversal patterns, it is crucial to wait for the reversal to confirm. These rules can help you reduce the risks of bumping into a sudden price direction change which can happen any second, invalidating your pattern analysis, and converting your rushed transaction into a loss.
Also, while there is no rigid period of validity for the signals you derive from the chart patterns, you have to act on them in a timely manner.
For example, a long-term trend observed across multiple candlesticks on a daily time frame will probably grant you a couple of days for decision making. A trend reversal observed on a 15m time frame means that you have to act on it within the next 30 minutes.
Use the Help Center
There are numerous chart patterns and trading strategies that may fit your financial objectives. Olymp Trade’s Help Center is a comprehensive knowledge base that may help you expand your knowledge and get practical tips on using it.
Risk warning: The content of the article does not constitute investment advice and you are solely responsible for your trading activity and/or trading results.


