Bollinger Bands is a popular technical indicator that may be configured to a trader's required settings. In the “Bollinger Bands for Beginners”, we review the general idea of this indicator and where to find it on the platform. In this article, we examine the bollinger bands formula and use it in detail.
Contents:
- Bollinger bands strategy: Calculation and formulas
- Period and Deviation Values
- Price and Time Frame
- Bollinger Bands’ Signals
- More Tips on Bollinger Bands
Interact with the underlined words and green dots to get additional details and explanations.
Bollinger bands strategy: Calculation and formulas
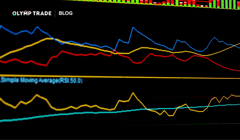
Bollinger bands indicator are formed by three lines. Among these, the middle one is the Simple Moving Average.

Below is the formula based on how Bollinger Bands are constructed.
BB = MA ± k * StdDev
Here is what each of the variables in this formula stands for:
- MA is the moving average.
- StdDev is a standard deviation.
- k is the standard deviation coefficient. It is usually equal to 2, which makes 95% of all price values fall within the Bollinger Bands’ price range.
The standard deviation StdDev is calculated as the following:
StdDev = SQRT (SUM ((CLOSE – SMA (CLOSE, N))^2, N)/N)
Here is what this formula includes:
- N is a number of periods which are used to calculate the Simple Moving Average. By default, it is set to 20 on the platform.
- SQRT is a square root function.
- SUM is a sum function.
Period and Deviation Values
Traders can set the number of periods and deviations in the setting of the Bollinger Bands indicator.
While the recommended period range for Bollinger Bands is 13 to 24, 20 is the most commonly used. Generally, you can set any number you want here. However, keep in mind that the larger the number you enter, the less the sensitivity of the indicator. Therefore, if you put something like 200 as the period value, the indicator may become of little use under conditions of low volatility.
The deviation is usually set within a range from 1.5 to 5. Values of 2 or 3 are used most often.
Most of the time, the price of your trading instrument will move within the area of the band indicator. That’s the normal way Bollinger Bands work.
If the price tends to cross the upper or lower band too often, you may want to increase the period.
If the price reaches the upper or lower band too rarely, you may want to reduce the period.
In both scenarios, the objective is to make the bollinger bands indicator as close and responsive to the price performance as possible to give you the best observation for finding market entry points.
Price and Time Frame
Bollinger Bands are calculated usually based in the closing prices. Average or weighted average prices can also be used.
Bollinger Bands work well on any time frame. However, most often, this indicator is used for day trading.
Bollinger Bands’ Signals
Trade the Middle Band
If the price crosses the middle band upwards, it is an Up trade signal signal.
If the price crosses the middle band downwards, it is a Down trade signal.

Trade the Bands Breakouts After the Price Reverses into the Channel
In this scenario, you will watch for the spots where the price breaks out of the Bollinger Bands’ channel.
First, you find such a spot.
It may be a green candle that takes the price above the upper band.
It may be a red candle that takes the price below the lower band.
Then wait for the price to start reversing back into the channel.
After a green or a series of green candles breaking out upwards, it would be a red candle taking the price back down.
After a red or a series of red candles breaking out downwards, it would be a green candle taking the price back up.
In both scenarios, wait for the reversal candle to complete inside the Bollinger Bands’ area. That would be a moment to open a position in the direction towards the middle band.
If the price reversed downwards, you would open a Down trade.
If the price reversed upwards, you would open an Up trade.

More Tips on Bollinger Bands
You can use the following observations of the Bollinger Bands indicator.
- When Bollinger Bands narrow, a flat period of price performance often comes next.
- If the price highs and lows outside the band are followed by highs and lows within the band, a trend reversal may be coming. .
- If the price movement starts at the upper band, it will most likely reach the lower one, and vice versa.
Now you know more about effectively using the bollinger bands trading strategy. Join the Olymp Trade team, develop your trading skills, learn new things and get a profit!
Trade with Bollinger BandsRisk warning: The contents of this article do not constitute investment advice, and you bear sole responsibility for your trading activity and/or trading results.