There are many contributing factors that together define how successful your trading activity may be. Among them, correctly forecasting prices and knowing when and where to open trades is key. This article shares ten simple techniques that can help you identify good market entry points. They’ll be useful for beginners in building their strategies and for advanced traders to expand their list of trading approaches.
Contents:
- Trend Analysis Based on Technical Analysis Patterns
- Trading on Economic News
- Trading on Corporate Earnings Reports
- Price Action
- Fibonacci Methods
- Oscillators
- Countertrend Strategies and Trading Psychology
- Moving Averages
- Trading with Olymp Trade’s Signals and Analytics
- Personal Consultation
- Discover and Combine
Interact with the dashed word and green spot on images to get additional details and explanations.
1️⃣ Trend Analysis Based on Technical Analysis Patterns
Market analysis consists of fundamental and technical analysis.
The latter is largely based on observing the trading instrument’s price performance on the chart and opening trades based on that observation. This approach started being studied and developed at the beginning of the 20th century. Currently, it offers a multitude of patterns from which all traders may find those that fit their trading strategy.
Applying technical analysis is simple. Basically, you just have to find one of the traditional price patterns on the chart. As it already suggests where the price will likely go afterwards, you open a trade in the corresponding direction and wait to close it with a profit.
For example, on the 30 minute S&P 500 chart below, we can see a sequence of three green candlesticks. Such a chart formation frequently precedes a strong uptrend. Therefore, seeing this pattern, traders would open a buy trade after it is complete, remembering to put a Stop Loss at the level of the lower candle’s low.

There are many such patterns, and there will always be some of them you can observe on the chart of your trading instrument. All you have to do is study them. The platform’s Help Center has a specific section dedicated to candlestick patterns.
As a result, you will have a solid base of technical analysis patterns that make the foundation of simple ready-to-go trading strategies.
2️⃣ Trading on Economic News
Fundamental analysis is essentially trading on the news that potentially affects the price of your trading instrument.
Such news may include any big company announcement, corporate quarterly earnings reports, a change of CEOs, monetary policy reports and interest rate press conferences by national banks, employment data, inflationary dynamics, global oil consumption, production forecasts, and much more.
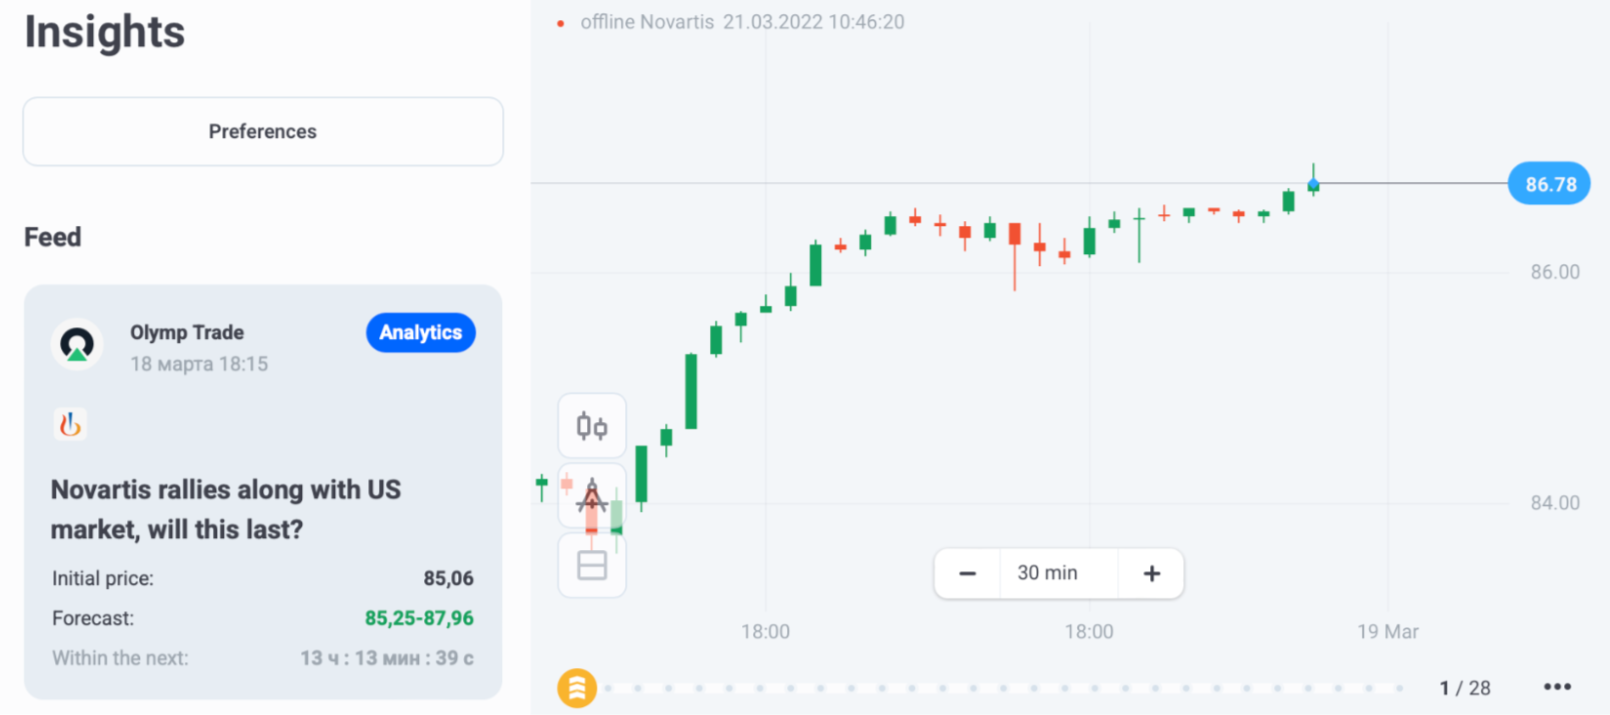
Almost every day of the week throughout the entire year, there is news to trade on. Olymp Trade’s Insights will help you find this news, see which asset it refers to, and open a trade in the corresponding direction.
3️⃣ Trading on Corporate Earnings Reports
We have already mentioned the option of trading on corporate earnings reports as a part of the fundamental approach of trading on economic news. However, trading on earnings reports is so popular that it deserves a separate explanation of why it is so good.
First, trading on earnings reports is a regular possibility. Corporations share their performance once every three months.
Second, most reports come within the same period of three to four weeks, often called the Earnings Season.
It is useful because you can spend the two “empty” months studying the stocks you want to trade. Later, in the month of reporting, you make trades on all the stocks together.
Third, there is no way you miss Earnings Season because the Olymp Trade platform will provide you notifications in advance. Also, it will keep notifying you which reports come on the corresponding week and suggest tips on opening trades on them. Moreover, you can improve your knowledge about Earnings Season with the Help Center’s section on this topic.
Lastly, it’s not uncommon to see really big price moves upon the reports. Therefore, the earnings reports potentially provide good profit-making opportunities.
For example, the long red candlestick on the chart below is what happened to the Meta (Facebook) stock price after it reported its earnings in February 2022.

4️⃣ Price Action
Price action is most suitable for intraday trading. It is largely based on evaluating the candlestick formations in relation to support and resistance levels. Often, such understanding helps to find trend reversal or acceleration points. These are usually very good market entry points.
For example, on the NZD/USD chart below, we see a mild uptrend. It kept formation as long as the price was moving back and forth to the indicated resistance line. Later on, it was confidently broken, and the price went on to establish itself at higher baseline levels. Therefore, when traders saw this resistance line breakout, that would have been a good moment to open a buy trade.

5️⃣ Fibonacci Methods
The Olymp Trade platform offers two indicators that belong to the Fibonacci group, Fibonacci Levels and Fibonacci Fan. They are accessible through the Indicators menu.
Fibonacci indicators are ready-to-use technical tools that indicate the levels where the price may reverse the trend or accelerate.
As such, they may be effectively used for identifying signals to enter the market.

6️⃣ Oscillators
Trading on trend reversals may be a highly efficient intraday strategy. Oscillators are a very good tool for that.
Oscillators are a technical analysis tool that is used to see the strength of a trend at a given point and check whether the price is in the overbought or oversold zone. The latter is what indicates a possible trend reversal.
On the Olymp Trade platform, oscillators are accessible through the Indicators menu. This section lists all the most popular oscillators including the RSI, MACD, and the Awesome Oscillator.
If you look at the 1 hour chart of EUR/GBP, you will see that the lowest point of the price at 0.8380 corresponds to where the RSI’s purple line drops below 30. That is the oversold zone.
Once the RSI indicator crossed that level bottom-up, that would be an indication of a new uptrend forming and a moment to open a buy trade. This is how helpful an oscillator can be.

7️⃣ Countertrend Strategies and Trading Psychology
Trading on the “scary” news is another specific section of news trading, which at a larger scale forms part of fundamental analysis.
This approach is based on the logic that the market quickly reacts to any big pessimistic news release. Whether such a release is later on confirmed to be a real economic or geopolitical threat, it doesn’t matter. The market is made of people, and people are emotional. Hence, they often emotionally react even to something that in reality may be an exaggerated and negative private opinion or one of the many possible outcomes.
For example, a threat to current global oil production may push the price of Brent upwards. Therefore, a security incident at an ARAMCO site in Saudi Arabia or a military escalation in the Middle East that concerns oil-producing countries such as the UAE or Iraq would likely be a scenario to trade oil.
Alternatively, any large geopolitical tension announced by world leaders may also be news to trade on. In 2018, at the time of the US-China economic confrontation, the media were often sharing alarming citations of the country leaders and observers to trade on.
Finally, in 2020, when the news about the spread, impact, and implications of Covid-19 made its way into the media, the stock market eventually lost up to 30% of its value. Therefore, if you were to trade on the market’s panic, that was the right time to do so. In the future, any such news is a good candidate for this type of trading.
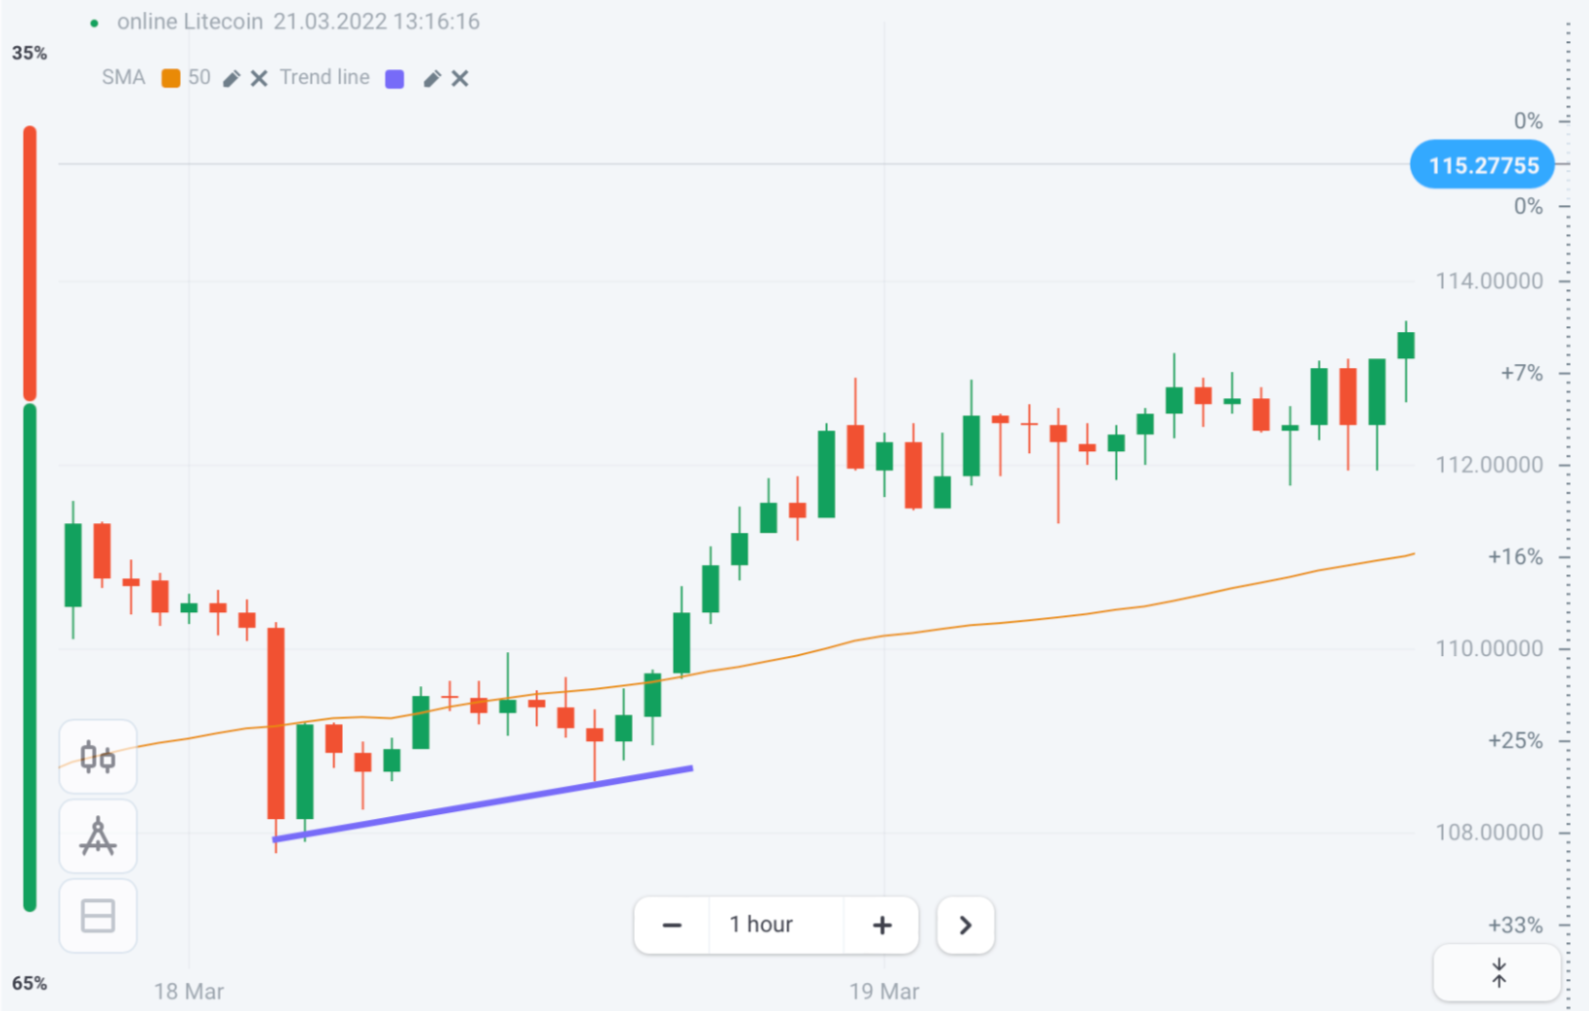
8️⃣ Moving Averages
The Simple Moving Average, or SMA, is one of the most effective and easy-to-use trend indicators.
One of the simplest ways to use it is to see whether the price of a trading instrument crossed the SMA Up or Down.
If the price crosses the SMA Up, it is a signal to open an Up trade.
If the price crosses the SMA Down, it is a signal to open a Down trade.
For example, on the Litecoin chart below, the price went below the SMA set at 50 periods. After staying there for a while, it crossed the SMA up in a confident manner. For many traders, that would mean opening an Up trade after that upward crossing.
9️⃣ Trading with Olymp Trade’s Signals and Analytics
Olymp Trade’s experts regularly publish a variety of analytical reviews which you can use to trade with.
These Expert Analytical Reviews provide price forecasts for various trading instruments, which are effective for quick and well-founded trading decisions.
Also, you may find useful information on the Olymp Trade platform about advisers and trading signals. Both can be effective technical tools to improve the outcomes of your trading process.

🔟 Personal Consultation
With Olymp Trade, traders can use the help of a personal trading consultant to reach higher trading levels quicker. This is an option that is available with different regularity on both the Advanced and Expert statuses.
Advanced traders can have one personal consultation a month, Expert traders can have four of them.
In both cases, these consultations are scheduled through Olymp Trade’s support department.
This tool can help traders form a customized learning process that takes them to their required trading levels faster. Also, they get to see real-market examples of trading and risk-management decisions made by an Olymp Trade expert.
Discover and Combine
This list doesn’t contain all the possible trading approaches that you can apply with Olymp Trade. Rather, it shows you various directions you can follow to discover the ways that best suit your trading objectives.
Olymp Trade strives to bring you the tools you need. You can check them out at the Help Center. Also, learn what you receive as a benefit of each available status.
Try It Out on a DemoRisk warning: The content of the article does not constitute investment advice and you are solely responsible for your trading activity and/or trading results.