StochRSI is essentially a hybrid of two oscillators, Stochastic and the Relative Strength Index, or RSI. Created by the famous US traders and technical indicator developers Stanley Kroll and Tushar Chande, StochRSI is thought to combine the best qualities of the two original oscillators and determine overbought and oversold price periods with higher accuracy.
Contents:
Interact with the underlined words and green dots to get additional details and explanations.
Accessing Stochastic RSI
There are currently two ways to access the StochRSI indicator.
First, you can get it on Olymp Trade’s market for a monthly subscription of $6.
The second way to get the StochRSI indicator is by reaching the third milestone from Starter to Advanced in Trader’s Way, after which it is gifted to your account.
Finding and setting StochRSI
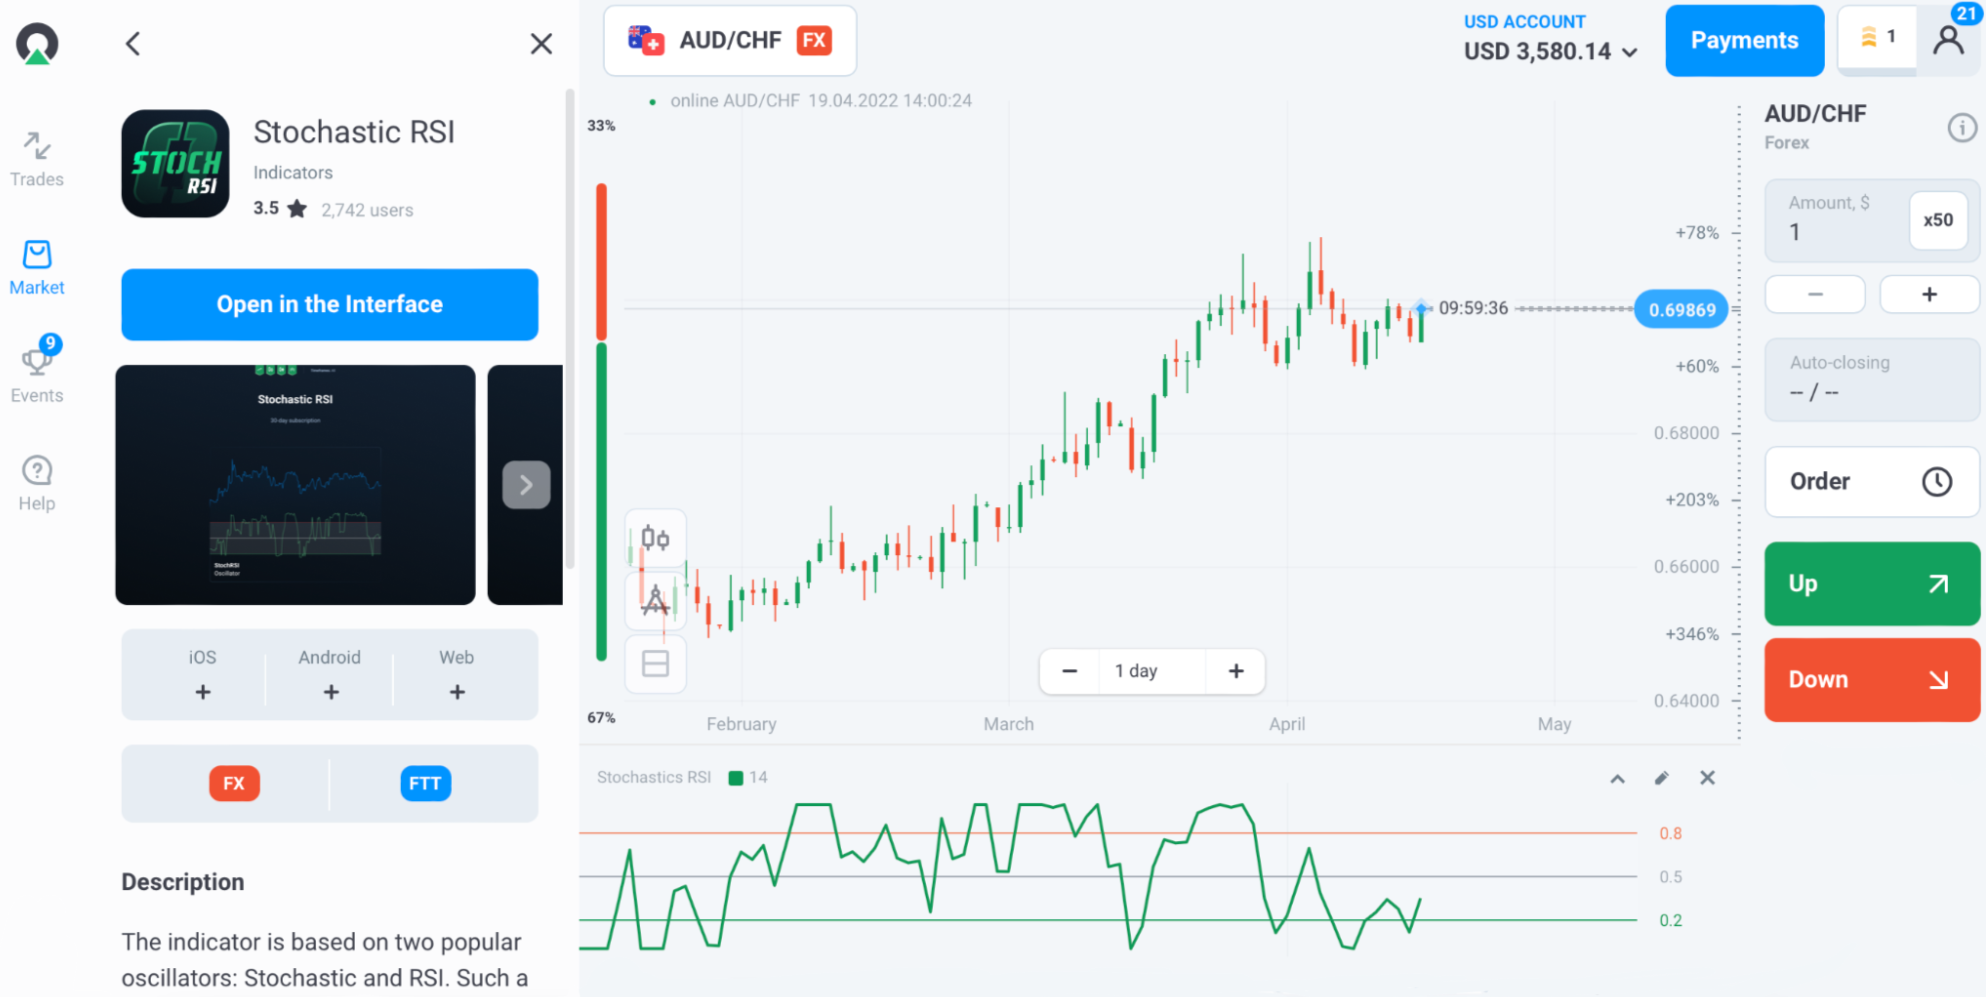
To find the StochRSI indicator on Olymp Trade, access the technical analysis tools by tapping the compass sign at the bottom-left corner of the main screen. A list of indicators will appear on the left sidebar, with Stochastic RSI under Oscillators.

By default, the StochRSI indicator’s period is set to 14, as this is the recommended value. You can change it by tapping the pencil sign on the top-right corner of the indicator’s chart.
Example of Stochastic RSI use
Overbought and oversold level crossing
For the first-type signal provided by this indicator, two zones on the StochRSI chart are key.
The upper zone above 0.8 is the overbought zone, and the lower zone below 0.2 is the oversold zone. It is usually considered a signal to open a trade when the indicator returns from either of those zones into the middle zone, between 0.2 and 0.8.
When the StochRSI crosses the 0.2 level from below, it’s a signal for an Up trade.
When the StochRSI crosses the 0.8 level from above, it’s a signal for Down trade.


Divergence
The second type of StochRSI signal is divergence.
Divergence is when the indicator line and the price are moving in opposite directions. For example, if the price goes up while the indicator heads down, or vice versa, that’s a divergence.
This signal is not precise enough to be used for market entry, but it is good for indicating a trend change.
When the StochRSI goes up in the oversold zone and the price goes down, that means a new uptrend may soon form.
When the StochRSI goes down in the overbought zone and the price goes up, that means a new downtrend may soon form.


Keep exploring
Stochastic RSI is a very useful and popular indicator, but it’s not the only one. Olymp Trade has many. Study them via our blog articles and the Help Center to find those that best fit your needs.
Risk warning: The contents of this article do not constitute investment advice, and you bear sole responsibility for your trading activity and/or trading results.