Bollinger Bands is a technical tool developed by the American financial analyst John Bollinger in the 1980s to forecast the expected price change range and help find potentially good market entry points.
Bollinger Bands is a technical tool that performs two functions:
- Trend indicator
- Oscillator
Contents:
- Bollinger indicator: What does it look like?
- Mechanism bollinger indicator
- Bollinger band trading
- Bollinger bands is an indicator to explore
Interact with the underlined words and green dots to get additional details and explanations.
Bollinger indicator: What does it look like?
To chart the Bollinger Bands indicator, tap on the bottom-left compass sign to open the Technical Analysis menu with the list of Indicators. Bollinger Bands will be right there, after the Moving Averages and the Parabolic.

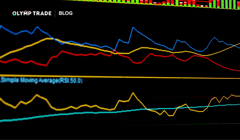
The Bollinger Bands indicator looks like an area that simply contains the price movement and is made of three lines.

The purple one at the center is a Simple Moving Average set at 20 periods by default. You can change that by tapping on its top-left sign and entering your desired number of periods.
The two orange side lines are the bands that are set at two standard deviations away from the Simple Moving Average. You can change the number of deviations, too, by tapping at the corresponding sign of this indicator component at the top-left corner of the chart.
Mechanism bollinger indicator
The range of the bollinger indicator bands changes according to the price volatility. It usually expands when a new trend starts forming. Frequently, it takes place in the period of high volatility. Its mechanism is based on standard deviations when constructing the sidelines. That’s why it makes it visible when the price deviates too far away, suggesting a potentially good moment to open a position.
Bollinger band trading
Look for the moment when the price leaves the Bollinger Bands’ area. That would likely be a strong movement that potentially makes enough room for profit making if you open a trade on it.
When the price breaks above the higher band, it will likely drop soon.
When the price breaks below the lower band, it will likely rise soon.

On the ![]() Ethereum chart above, you can see a red candlestick that crosses the lower Bollinger Band downwards. This spot is highlighted by the light blue line. That would be an indication for you to prepare to open a position. However, at this moment, you’d have to wait until the downswing stops.
Ethereum chart above, you can see a red candlestick that crosses the lower Bollinger Band downwards. This spot is highlighted by the light blue line. That would be an indication for you to prepare to open a position. However, at this moment, you’d have to wait until the downswing stops.
Later, you’d see that the price bottomed out as the dark blue line shows. That’s where you’d open a buy trade and set your Trake Profit in the area of the Bollinger Bands’ central line.
Bollinger bands is an indicator to explore
The above example is just one of various possible uses of the bollinger indicator. Because of its relative complexity, it allows different approaches, and you’d likely find the one that best fits your trading style. Check its description in the Help Center to better understand and apply it.
Also, you may be interested in checking one more article on this indicator, “Bollinger Bands for Professionals”. This article goes in depth about how to set, calculate, and use this tool. Learn and bollinger band trading with Olymp Trade!
Try this Indicator on the PlatformRisk warning: The contents of this article do not constitute investment advice, and you bear sole responsibility for your trading activity and/or trading results.