In explaining how to trade Forex for beginners, this Blog article examines breakouts. It provides visuals to spot them, approaches to trade them, and guidelines to avoid false breakouts. Therefore, it may be practically valuable to any beginner trader eager to learn how to make money trading Forex or any middle-level trader who wants to level up his skills.
Ready to learn how to trade Forex breakouts? Let’s go! 😎
Contents:
- To Start With: Breakout Definition
- Consolidation Before a Breakout
- Two Approaches to Register a Breakout
- Spotting Breakouts
- Breakouts and Level Retesting
- Conclusion
Interact with the underlined words and green dots to get additional details and explanations.
To Start With: Breakout Definition
Interaction between a trading instrument’s price and resistance or support levels is the core of technical analysis. Most of the time, the price either gets deflected by them or breaks them. The former happens more often. The latter is a breakout.
A breakout happens when the price breaks an important resistance or support level.
When the price moves up while crossing a level, it’s a bullish breakout.
When the price moves down and crosses a level, it’s a bearish breakout.
Consolidation Before a Breakout
Before a breakout, a price consolidation often happens. Frequently, it means that the market is gathering momentum before starting an aggressive move. That’s why the longer the consolidation, the more intense an ensuing breakout may be.
The daily gold chart of 2019 below showcases this scenario. From July through August, the price was consolidating at the baseline level of $1,400 before making an aggressive move up to $1,500.

While the resistance level of this consolidation stayed steady at $1,430 all along this period, the lows were gradually getting higher above $1,400. That could indicate that an up movement was coming.
Also, in the middle of that consolidation, there were two days when the price inched above the resistance level of $1,430 but then quickly returned into the flat channel. This is a false breakout example, and we’ll study it later in this article on basics of Forex trading.
Two Approaches to Register a Breakout
One approach considers any case when a price moves beyond a previous maximum or minimum, or crosses the last high or low as a breakout. In such cases, candlestick extremes, or the very tips of the candle's shadows, are taken as resistance or support levels against which the price is observed.
Another approach waits for the price to retest the level and move past it to some extent to confirm the breakout. It is particularly helpful to avoid false breakout.
Spotting Breakouts
Identifying breakouts is a must-have still for any trader how wants to make money by trading Forex. Here are the instructions:
False Breakouts and Confirmed Breakouts
On the weekly chart below, the gold price stepped into the zone above $1,900.

A real-time observer could see that as an indication of a coming breakout for various reasons.
First, $1,900 is a round number and therefore, an important psychological level that paves the way to the zone of the all-time highs beyond $2,000. Also, this resistance level deflected the price down several times before it came to challenge it at the moment of observation presented on the chart.
Therefore, this case is a perfect candidate for a notable breakout. However, “candidate” is the key word here as the most common mistake with breakouts is taking its possibility for a fact.
No indicator guarantees a successful interpretation of the price behavior and a correct direction forecast.
The market does what it wants; that’s the fundamental idea that everyone investigating how to make money trading Forex should understand. Thus, the price may “change its mind” at any time even if the breakout seems to be forming. As the chart below shows, the gold price eventually failed to cross $1,900. Therefore, what we saw before was a false breakout. The price “flirted” with the key resistance level of $1,900 for a while and went into a long decline.

Therefore, you can only confirm a breakout in retrospect. The approach that suggests waiting for the price to retest the level and move past it to confirm the breakout may help with that.
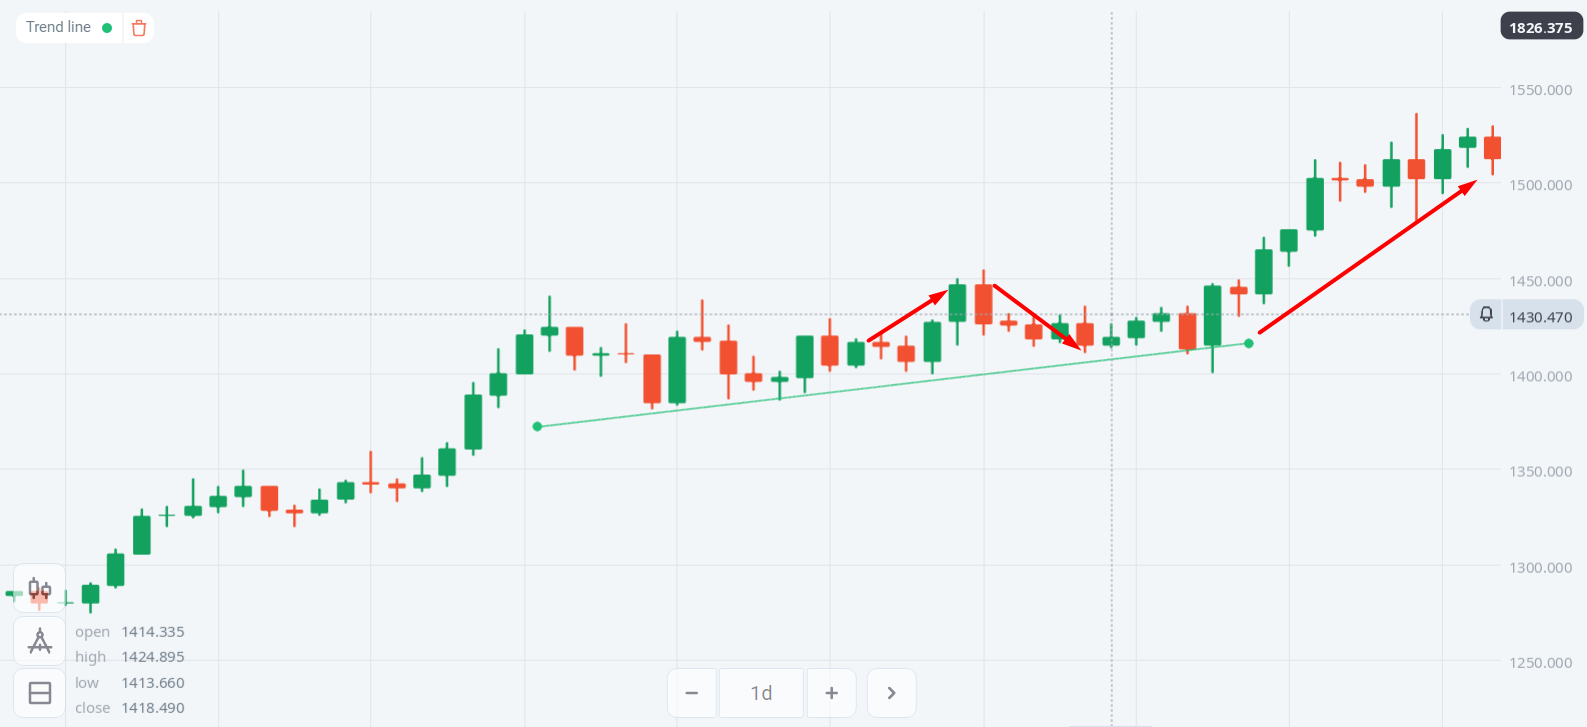
On the gold daily chart below, the price climbed to $1,800 after bouncing from the bottoms of $1,700. It came to challenge $1,800, went back down a little bit, and then went to cross this level with a confident bullish candlestick. That is a true breakout, and we confirmed it with the above explained method.

In this case, the first episode of retesting comes straight after the breakout of the resistance level of $1,760. The second one happens after the price crosses $1,815 upwards, and then price goes back down to that level. Both cases are indicated as red arrows that follow breakouts marked as green ones.
How Can You Avoid Falling for a False Breakout
On the chart below, a false breakout takes place around the resistance level of $1,430. The price just inches above it and then quickly goes back down. Such “indecisive” price behavior is often called “flirting” with a level, and it often happens in false breakouts.
Traders often take that flirting as a sure indication of a coming breakout. Here are some tips to avoid that.
First, time-confirm a breakout.
Allow the price some time to establish itself over the level it has just broken. Don’t rush to open trades on an unconfirmed breakout. Beware of an ever-present possibility of a reversal.
Second, use multiple timeframes.
The Olymp Trade platform offers timeframes as short as 15 seconds up to one-month view.
Larger time frames may be useful to check if an intraday breakout you’re observing may be relevant to strategic resistance or support zones.
Lower time frames may help to check short-term market dynamics and detect possible trend reversals through observing corresponding candlestick formations.
Breakouts and Level Retesting
Usually, level breakouts are followed by level retesting. That means that after breaking a resistance or support level, the price usually comes back to it from the other side before going back into the direction of the breakout.
After a confident upward push, there is often a downward correction.
Conversely, after a heavy plunge, there is at least a partial bullish comeback.
Many traders open positions exactly at the moment when the price is retesting a level after breaking it.
For example, on the 10-minute gold price chart below, the breakout of the key resistance level of $1,900 stopped at $1,905. After reaching it, the upward push started going weak, and the price went into a sideways consolidation at $1,905.

A downward correction back down to $1,900 could be coming. That was a level retesting, and it would be an opportunity to open a position.
Conclusion
Breakouts are often preceded by a period of consolidation and followed by level retesting. A possibility of a false breakout is a constant risk that accompanies them.
In either case, there are ways to increase the quality of your decision making when trading breakouts. The main one is to wait for the price to confirm the breakout and not rush into action when it has just formed. Therefore, observation and patience are key.
Olymp Trade’s team is always there to help you improve your skills, and you are welcome to visit the platform’s Help Center to better understand how to make money by trading Forex.
Trade Breakouts on Olymp TradeRisk warning: The contents of this article do not constitute investment advice, and you bear sole responsibility for your trading activity and/or trading results.