
The diamond chart pattern is a reversal pattern showing where the price will likely change direction. Usually, the diamond pattern appears at the top or bottom of a trend where close attention to the price momentum is needed to find the exact reversal point.
In financial market trading, it is crucial to find where the current trend is going to finish and the opposite party will appear. Finding this market behavior will make it easy for a trader to grab the full juice from a trend. Therefore, if you are keen to build a strong trading portfolio in Olymp Trade, a good understanding of trend change is important where the diamond pattern plays an important role.
Contents:
- What Is the Diamond Chart Pattern?
- How To Spot The Diamond Top Formation
- How To Trade The Diamond Chart Pattern
- Diamond Bottom Chart Pattern Trade Setup
- Diamond Top Chart Pattern Trade Setup
- Conclusion
Interact with the underlined words and green dots to get additional details and explanations.
What Is the Diamond Chart Pattern?
The diamond chart pattern is a combination of candlesticks that appear at the top and bottom of a trend to show what the opposite party may do with the price.
Although it is similar to the traditional head and shoulder pattern, the difference is in the neckline.
The diamond pattern has bullish and bearish versions with exact entry and exit points. For example, if a diamond pattern appears within a bearish trend, the price may rebound higher. This concept also matches the accumulation and distributional nature of the market, where inside the diamond pattern is an order-building process before showing a reversal.

The above image is a basic illustration of the forex diamond pattern where the price violates near-term swing levels before squeezing to a narrow zone. Once the price breaks out from the zone, it will open the Up/Down opportunity in the price chart.
A trader needs to understand what is happening within the pattern. In bullish and bearish patterns, the price starts making new highs and lows, indicating increased buyer and seller momentum. However, at the end of the pattern, both parties give up chasing, and the price ends the pattern with indecision.
How To Spot The Diamond Top Formation
Finding the diamond chart pattern requires close attention to the price action.
Let’s consider what conditions traders should follow to spot the diamond pattern:
- Find the trend. The diamond top pattern should come after a strong bullish trend. Find the conditions where the current price is increasing by creating new highs. It applies to any market with no barrier on timeframes.
- The price is shaped like a diamond, tilted on one side.
- A new high and low appeared and ended with a squeeze, indicating that bulls and bears failed to extend their presence in the market.
- A candle closes below this pattern and validates it.
How To Trade The Diamond Chart Pattern
As a trend reversal pattern, the diamond pattern shows an exact zone from where highly profitable trade generation is possible. Moreover, it also provides a good risk vs. reward ratio as the trading entry point from this pattern comes from the top and bottom.
In the diamond pattern trading strategy, basic knowledge of trends, candlesticks, and price action is needed. However, finding the pattern is not the final step in trading. Traders should match the sentiment with price actions to generate highly profitable trades.
Diamond Bottom Chart Pattern Trade Setup
In the diamond bottom trading strategy, we will find a bearish trend where the price should make consecutive lower lows as shown in the image below.

The above image represents the ![]() EUR/USD intraday chart where the bearish trend is visible as the price is moving down by creating lower lows.
EUR/USD intraday chart where the bearish trend is visible as the price is moving down by creating lower lows.
Entry
Within the downtrend, a diamond bottom pattern should appear and after spotting the pattern. Wait for a bullish breakout.
The entry is valid once a bullish candle closes beyond the Diamond pattern.
The trading approach is to set the amount with the proper multiplier and hit the Up button from the Olymp Trade platform.

Stop Loss
The primary approach to setting the stop loss is below the diamond pattern swing low. You can easily set the Stop Loss by clicking the auto-close button from the Olymp Trade platform.
Take Profit
If the price moves higher from the entry-level, wait for 1:2 risk vs. reward to appear and close the trading position.
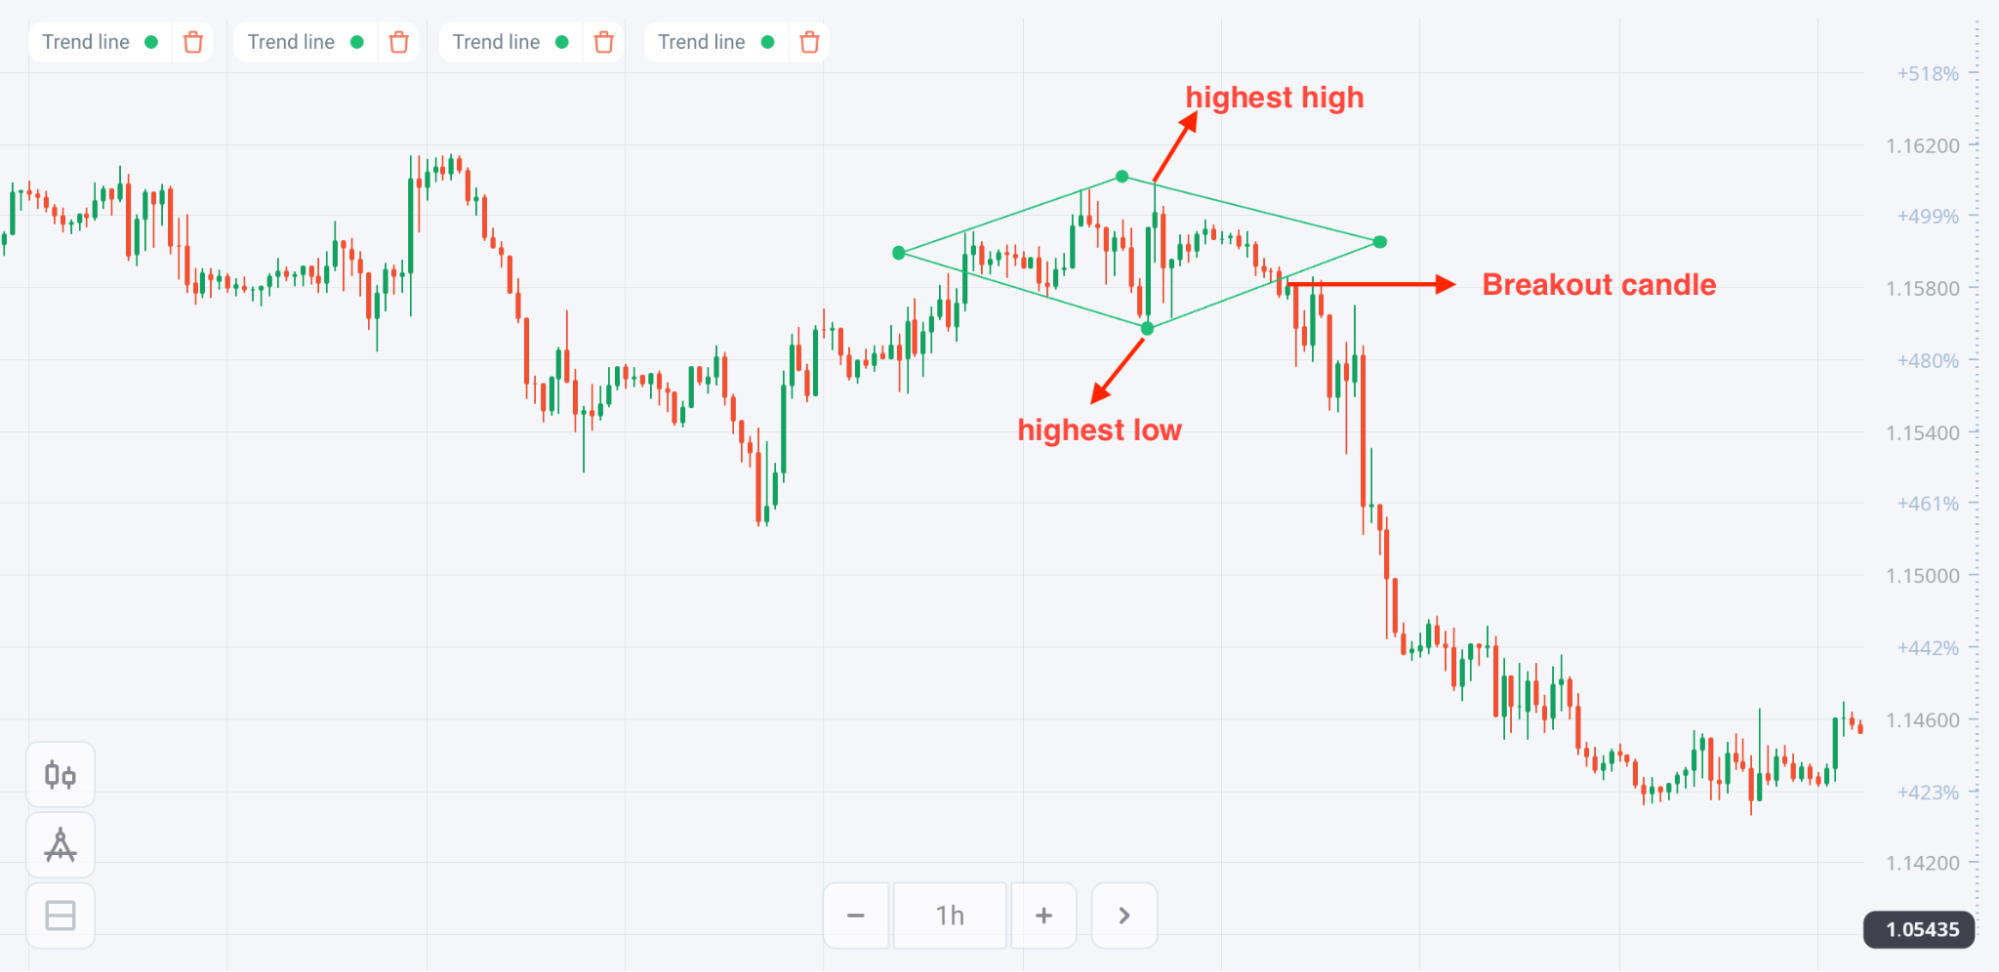
Diamond Top Chart Pattern Trade Setup
The diamond top chart pattern is the opposite version of the example above. In this case, you have to find a bull market where consecutive higher highs are coming.

The above image represents the ![]() EUR/AUD intraday chart, where the bullish trend is represented by consecutive higher highs. In a diamond pattern bearish trade, it is crucial to find the bullish trend applicable to any timeframe and trading instrument.
EUR/AUD intraday chart, where the bullish trend is represented by consecutive higher highs. In a diamond pattern bearish trade, it is crucial to find the bullish trend applicable to any timeframe and trading instrument.
Entry
The bearish diamond pattern should appear within a bullish trend where the trading entry is valid if there is a bearish breakout from the pattern with a candle close.
After finding these conditions, set the amount you want to buy and click the down button from the Olymp Trade platform.
Stop Loss
The primary approach is to set the stop loss below the diamond pattern swing high.
Take Profit
Close the trade if it reaches the 1:2 risk vs. reward ratio.

Conclusion
Trading diamond patterns can be profitable if traders identify ideal market conditions. Moreover, this method applies in any financial market like forex, stock, indices, cryptocurrencies, and futures. As the diamond pattern is different from traditional chart patterns, it needs closer attention to the swing levels to recognize it.
Based on backtesting, increased success in diamond pattern trading is found when it appears from the higher timeframe support/resistance zones from where the reversal possibility is high. However, utilizing it with RSI or MACD will also increase the probability. The detailed use of RSI and MACD are available in the Olymp Trade blog technical analysis section.
You can test your knowledge gained in this article on the Olymp Trade platform by using their free demo account. We're happy to help you learn new trading skills. The Olymp Trade platform is not only functionally convenient for trading, but also has an extensive list of training materials. Register, learn, and trade!
Try the DemoRisk warning: The contents of this article do not constitute investment advice, and you bear sole responsibility for your trading activity and/or trading results.


