Support and resistance levels are basic concepts within technical analysis. Traders who know how to find them are granted the ability to perceive and predict the behavior of price movements.
Support and resistance are price zones with a high chance of rejection. That is, when the price approaches one of these levels, it reverses its movement, heading instead in the opposite direction.
In this article, we explain why these price regions are so important 📍
Contents:
- Support levels
- Resistance levels
- The support and resistance indicator on a chart
- Support and resistance at price levels
- Trend channels
- Technical Indicators
- Сonclusions
Interact with the underlined words and green dots to get additional details and explanations.
Additional context for the visuals.
Explanations and definitions of terms.
Support levels
Sitting below the asset’s current price, support zones are areas where a falling price is likely to get rejected. Therefore, support levels are regions that are always below the currently traded price. Regardless of whether the asset is making an upward or downward trend, support levels can be used as a reference for determining entry points.
Because support levels are always below the current price, we can reasonably expect that the price will revert to an upward movement shortly after reaching a support level. However, this isn’t always the case: When the support level fails during a retest, a breakout happens. Typically, this breakout can push the price down hard for a variety of reasons, the main ones being low interest on the buy side at the support level and high interest on the sell side exceeding that of the buy side.
Resistance levels
The opposite of support levels, resistance levels are always above the current asset price. These zones are areas where a rising price is likely to get rejected.
When approaching a resistance level, the price is expected to revert to a downward movement. However, just like with support levels, the resistance level may fail to hold.
Resistance levels are just as susceptible to breakouts as support levels, so traders need to analyze each situation within its context and assess the reliability of these levels.
The support and resistance indicator on a chart
Now that we understand the concept of support and resistance, the main question remains: How can we draw support and resistance on a chart? Thankfully, there are some tools that help traders identify these points.
Below are the main ways to visualize support and resistance levels.
Support and resistance at price levels
Drawing support and resistance levels at key price points is the best-known way to chart them, because the upper and lower limits of the market are entry and exit points with the most potential. They are also simple to mark, because they are easy to see.
For example, on Olymp Trade, you can use the Horizontal Line feature available under the Drawing section in the Technical Analysis Indicators sidebar to draw a straight line. This will help you more easily visualize the support or resistance level on the chart.
We recommend considering these support and resistance levels as zones rather than strict boundaries. This will help calibrate your trade entries and exits and eliminate the effects of small market fluctuations.

You can open the Indicators sidebar here.
Trend channels
Slightly different from support and resistance levels are channels, which can be seen when the market is in a clear trend. A channel is drawn with two diagonal lines that are parallel to each other, plotting a possible price movement within its boundaries.
On Olymp Trade, the Trend Line feature under Drawing in the Technical Analysis Indicators sidebar makes it easier to see support and resistance channels. If you’re wondering what the other indicators in the list are for and how they can enhance your trading strategy, check out our article on the best Forex trading tools.
Drawing channels also makes it easy to identify the current price trend. For example, if the channel is in an upward trend, the asset will also be in an upward trend, allowing the trader to follow the direction and carry out trades based on the current momentum.

Technical Indicators
Numerous technical indicators assist traders in visualizing support and resistance levels. Why? Because they can identify support and resistance levels automatically.
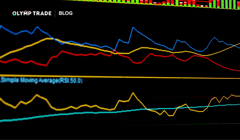
Moving averages is a calculation that identifies the average change in a data set over time. Based on the values of previous candles, a moving average indicator can determine potential support and resistance levels.

In this image, we can see the 50 Exponential Moving Average (EMA) as a resistance in a downtrend. Moving averages are used to point out a market trend, support and resistance zones, and price distortions. The EMA focuses on the latest closing prices, so the result is more dynamic, giving us a more accurate resistance level. With an EMA of 50 periods, we can track the one-day movement of prices for the previous 50 days. The longer the period, the stronger the level of resistance (or support).
We recommend trying to incorporate support and resistance levels into your trading strategy. Calibrate your indicators and check how they behave when the price approaches these levels.
Сonclusion
Support and resistance trading allows you to determine in advance the upside potential of shares and the size of a possible fall. Reading these levels opens up ample opportunities to select assets wisely for your portfolio and manage risk.
Join Olymp Trade and hone your trading skills using provided strategies and tools. The platform’s capabilities will impress even the most demanding traders. Olymp Trade is not only a multifunctional trading platform, but also a source of exclusive educational content tailored to helping our traders reach their financial goals. Become a force to be reckoned with on the markets with us!
Go to Olymp TradeRisk warning: The contents of this article do not constitute investment advice, and you bear sole responsibility for your trading activity and/or trading results.
When the price tries to return to the pre-breakout support or resistance level to test whether it will hold.
A trend is the overall direction of a market or an asset’s price.
Pattern-based signals generated by price, volume and/or open interest in an asset, used by traders conducting technical analysis.


