Pivot point — is a technical indicator, which serves to determine potential points of the asset price reverse.
The first mention of its use dates back to 1934. Over time, several varieties of Pivot Points have been developed, but they all work on the same principle of resistance/support levels.
The indicator is calculated from the average of the maximum, minimum and closing price of the asset. Pivot points are also called “reference points”, “points of growth”, “equilibrium points”.
Indicator formulas
The reference points are used to forecast potential key support and resistance levels. Main used time periods: day, week, month, year. The reference points of the support and resistance lines and the central axis of the Pivot point help to determine the direction of the price movement of the asset, using a minimum of calculations.
Formula
PP = high + LOW + close / 3
R1 = 2 * PP – LOW
R2 = PP + high – LOW
R3 = 2 * PP + high – 2 * LOW
S1 = 2 * PP – HIGH
S2 = PP + LOW – HIGH
S3 = 2 * PP + LOW – 2 * HIGH,
Where:
PP – is the central axis.
R- resistance
R1, R2, R3 – 1st, 2nd, 3rd resistance levels;
S – support
S1, S2, S3 – 1st, 2nd, 3rd support levels;
HIGH – the maximum price for the period preceding the determined one;
LOW – the minimum price for the period preceding the determined one;
CLOSE – the closing price of the period preceding the determined period.
Below are a few tips that are easy to remember and help you make reasonable decisions when trading with pivot points.
• If the price is at the PP level (pivot points), expect it to go in the direction of R1 or S1.
• If the price is at R1, expect movement to R2 or back to PP.
• If the price is near S1, expect movement to S2 or back to PP.
• If the price is R2, expect movement to R3 or back to R1.
• If the price is S2, expect movement to S3 or back to S1.
• If there is no significant news that could affect the market, the price usually ranges from P to S1 or R1.
• If there is important news that could affect the market, then the price can go straight through R1 or S1 and reach R2 or S2 and even R3 or S3.
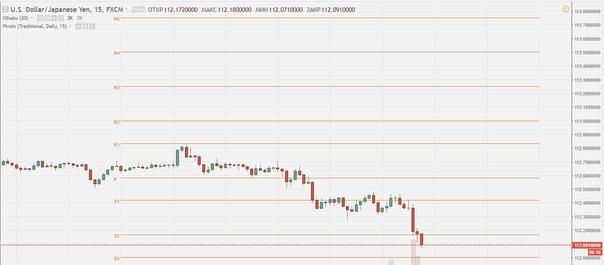
R3 and S3 are indicators of the maximum possible movement size, on days of high volatility, but achieving these levels is not so frequent. Pivot lines work well for lateral movements, where the price fluctuates mainly around R1 and S1. With a strong trend, the price breaks the pivot line and goes further.
Setting the indicator
On the chart from Tradingview, the indicator is called Standard reverse points:
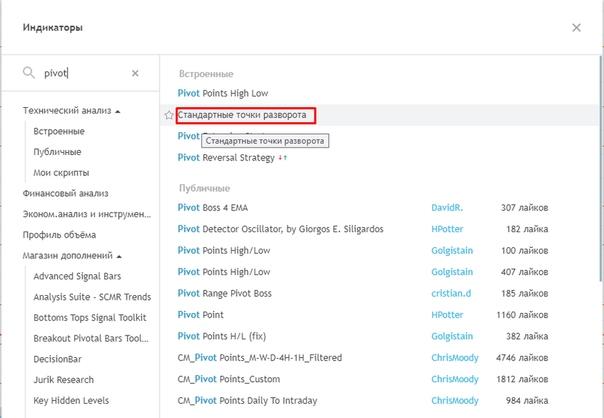
In the indicator settings, you can make some changes. You can remove the previous (historical) values, change the period and style of displaying the levels.


