Technical analysis is essentially about using chart data to forecast the price movement direction. Let’s review the main tools and techniques used for that.
Contents:
- Reading the Price Charts
- Identifying Trends
- Support and Resistance Levels
- Trading Pullbacks and Breakouts
- The Trend Is Your Friend
Interact with the underlined words and green dots to get additional details and explanations.
Reading the Price Charts
Technical analysis relies on reading price charts. Area, Bars, Heiken Aishi, and the Japanese candlesticks are the four chart types available on the Olymp Trade platform.
While all the available chart types show similar details of the price movement, Japanese candlesticks are most popular amongst traders as they are the easiest to read.
You can set the chart type you want in the bottom-left corner of the chart area by clicking the Chart Types icon.

On the Japanese candlestick chart, green candles show the up movement, and red is the down movement.
The thick part of the candlestick is called “body”. It shows the opening and closing prices of the observed period and the distance between them.
The thin lines are called “shadows”. They show the maximum and minimum levels the price ever reached during the observed period.
Therefore, with the green candles, the opening price is at the bottom of the body, and the closing price is at the top of it. With the red candles, the top of the candle’s body shows the opening price, and its bottom is the closing price.
Each candlestick shows the price performance during the chosen time period. The above chart is a daily price chart of gold. Therefore, each candlestick shows what the price did during one market day, and every day a new candle is formed. If it was a 5min time frame, each candle would show the price performance during a five-minute period, and every five minutes, a new candle would form. Using technical analysis for beginners will allow you to identify these candlestick patterns.
Identifying Trends
A trend is when the price keeps moving in the same direction for an extended period. Generally, there can be an uptrend, a downtrend, or a plateau when the price stays within a horizontal channel.
On the below chart, a long uptrend, a steep downtrend, and a plateau are indicated by the green, red, and purple lines, respectively.

Technically, if you can connect a series of highs or lows into a line, that will be considered a trend. Most often, if there is one, it is easily visible on the chart like in the case above.
The well-known trading maxim “the trend is your friend” means that you are more likely to make profitable trades, for example, in stocks, if you open them in the direction of the trend once you have identified it. But to determine this trend, technical analysis of stocks for beginners is necessary.
For more details on trading with trendlines, please check this dedicated article.
Support and Resistance Levels
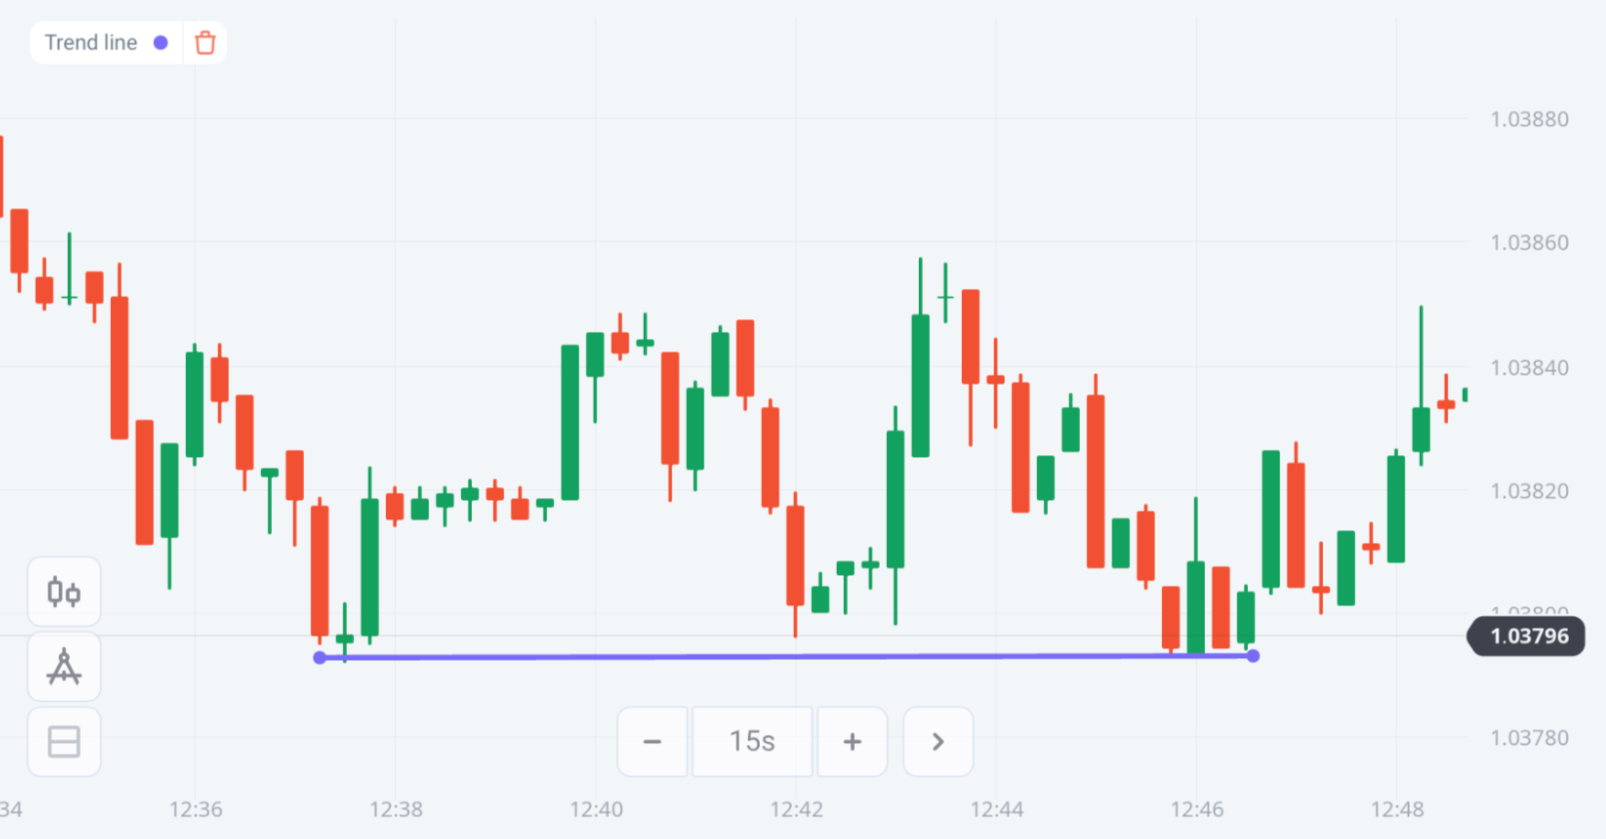
Support and resistance levels are those where the price may pause or reverse direction.
A support level is where a downtrend would stop or bounce back upwards.
A resistance level is where an uptrend would stop or get deflected downwards.

While support and resistance levels can coincide with trend lines, a single point reached by a price on the chart may create a support or resistance level too.
Also, support and resistance levels take turns sometimes.
A resistance level becomes a support level when the price rises and consolidates above it.
A support level turns into a resistance level when the price drops and fixes below it.
If the price tested the same support or resistance level many times, that level is usually considered a strong one.
Trading Pullbacks and Breakouts
Rebounds and Breakouts are simple trading strategies based on trends and support and resistance levels.
Pullbacks
A pullback is a short-term trend reversal. Opening a trade against the market, knowing that it will soon fall back into the main trend, is the core of this strategy.
Clear trends and support and resistance lines are the necessary conditions for this strategy.
Price movements that approach key trend lines or support and resistance levels are the potential profit opportunities. Look for long wicks showing price rejection against the trend along with increased volume as prices approach the floor or ceiling. A beginner's technical analysis will help you identify the trend line and make the right choice.
For example, the longer the run between pullbacks, the larger the pullback may be. Each pullback creates its support or resistance level, reducing the potential for a more profitable trade.
Trades are executed as prices approach notable levels in an attempt to capitalize on the entirety of the pullback. Using previous support or resistance established at previous pullback highs or lows.
Breakouts
This strategy suggests opening trades that profit from the price movement that breaks its support or resistance level.

A breakout trader opens an up trade after the price breaks a resistance level.

A breakout trade opens a down trade when the price breaks a support level.
After such a breakout, the price volatility often increases and takes it further in the direction of the breakout.
When trading on breakouts, identify the current price trend, support and resistance levels first. That is necessary to plan entry and exit points. Unlike Pullbacks, Breakouts require a channel created by the support and resistance lines. This channel means prices are likely to make a large jump or drop after breaking through either barrier.
Technical analysis for beginners helps to analyze and identify support and resistance levels.
The more times a key level has been tested, the more important it is. Also, the weaker it becomes, the greater the chance of a breakout.
With both the Pullback and Breakout strategies, be ready to exit the trade when momentum slows.
Also, when executing Fixed Time Trades following either strategy, set the trade Duration to the same interval as the chart’s Time Frame to minimize confusion and capture the full momentum of the candle.
There is a specific article about breakouts on the Blog, and we encourage you to review it for more details on this approach.
The Trend Is Your Friend
Technical analysis examines chart data to forecast the future price of a trading instrument. Therefore, understanding charts, trends, support and resistance levels is key. All that is required is skill and practice.
Pullbacks and Breakouts are two basic technical strategies that use these core concepts, and you can improve your skills with them on your Demo account to familiarize yourself with the market mechanics.
Remember that any skill is best honed in practice. This is especially true of the forex technical analysis for beginner's skills.
Go Trade ForexRisk warning: The contents of this article do not constitute investment advice, and you bear sole responsibility for your trading activity and/or trading results.