Olymp Trade analysts have developed a unique indicator, Inversion Bollinger. This article delves into its many applications.
Contents:
- Essence
- Recalling Bollinger Bands
- Inversion Bollinger structure
- Signals produced by the indicator
- Combining with other indicators
- Bollinger Bands made into an oscillator
Interact with the underlined words and green dots to get additional details and explanations.
Essence
As the name suggests, the Inversion Bollinger indicator is based on the widely known Bollinger Bands indicator. Similar to the latter, the Inversion Bollinger indicates when an asset’s price is in the overbought or oversold state and, together with other oscillators, helps identify trend reversal points with precision.

Recalling Bollinger Bands
As the Inversion Bollinger is developed on the basis of the Bollinger Bands indicator, we need to recall how the latter works to understand the former.
The Bollinger Bands indicator consists of three lines:
- The central line is the SMA, usually with a default period of 20.
- The upper line is the central line shifted up, usually by two standard deviations.
- The lower line is the central line shifted down, usually by two standard deviations.
The value of the standard deviation depends on the distance between the price and the 20-SMA. That is, it depends on volatility. The bands become wider when the market is in an active uptrend or downtrend, and move closer when the market moves sideways.
The main principle of Bollinger Bands is the following: With the two standard deviations set to the upper and lower lines, the price will usually reach above the upper line and below the lower line in 5% of cases. The remaining 95% will normally be contained in between the bands. If the standard deviation parameter is set to 3, then 99% of prices will be inside the indicator, and 1% outside, as per the probability theory.
Inversion Bollinger structure
Looking at the structure of the Inversion Bollinger indicator, let’s add another Bollinger Bands indicator with a standard deviation of 3 and turn on the intermediate levels +/- 2 sigma in the Inversion Bollinger settings.

Inversion Bollinger represents two “straightened” Bollinger Bands.
The oscillator shows the current price value relative to the 20-SMA, as well as the upper and lower Bollinger Bands with two and three standard deviations in the following situations:
- When the price touches the 20-SMA, the Inversion Bollinger is at the zero level.
- When the price crosses the upper band of the Bollinger Bands set at two or three standard deviations, the Inversion Bollinger will cross the +2 or +3 sigma lines, respectively.
- Likewise, when the price crosses the lower Bollinger Bands set at two or three standard deviations, the Inversion Bollinger will cross the -2 or -3 sigma lines.
Signals produced by the indicator
As the Bollinger Bands indicator helps identify trend properties, the Inversion Bollinger works in a similar manner.
Here is how the direction of the indicator suggests trend features:
- The indicator going above the zero level means the market is in an uptrend, below zero means downtrend.
- The indicator moving gradually from zero level to the +2 sigma or from the -2 sigma to zero means the trend is steady and calm.
- The indicator fluctuating near the +/- 2 sigma levels means that the market is in an active steady trend. On the Bollinger Bands, such a situation is called a “Bollinger Band Walk.” Particularly, it often occurs on assets related to JPY, and trading against this kind of trend is not advisable.
- The indicator returning from the area above +2 sigma or overbought zone, or returning from the area below the -2 sigma or oversold zone, is considered a signal for opening a trade.
- The indicator touching or breaking out the +/-3 sigma levels is considered the strongest signal for opening a trade.
Apart from the above point, keep in mind that the indicator becomes more sensitive during a sideways or flat market and less sensitive during active trends.
Signals to open an Up trade 
The indicator line crosses the -2 sigma from the bottom up.
The indicator line touches or breaks below -3 sigma.

Signals to open a Down trade 
The indicator line crosses the -2 sigma from top to bottom.
The indicator line touches or breaks above -3 sigma.

Combining with other indicators
Support and resistance levels
The Inversion Bollinger indicator is designed to forecast potential market reversal points, so support and resistance levels are most helpful to use with this indicator.
Frequently, trend reversals happen near important support and resistance levels. Therefore, it is advisable to add those levels to the price chart to the primary time frame you’re working with. Pivot Point and Fibonacci indicators can help identify them.
For example, if the price touches an important support, resistance level of support or resistance, and the Inversion Bollinger indicator touches or breaks beyond the +/- 3 sigma at the same time, the signal for opening a trade will be considered more reliable.
Relative Strength Index (RSI)
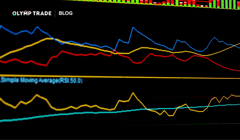
RSI is a momentum oscillator similar to Inversion Bollinger. Oscillators help identify when the market is overbought or oversold, but they are based on different mathematical approaches. Therefore, using them together with the Inversion Bollinger helps forecast trend reversal points with greater accuracy.
For example, if the RSI or a similar oscillator is overbought or oversold at the time of the Inversion Bollinger signal, the resulting signal will be more reliable.

On the left side of the chart, the RSI reached and crossed the 30 level, indicating that the price is in the oversold state. On the right side, the Inversion Bollinger reached the +3 sigma line but the RSI didn’t signal a potential reversal, weakening the signal.
Bollinger Bands made into an oscillator
As the Inversion Bollinger is essentially the Bollinger Bands indicator turned into an oscillator, the former has the pros and cons of the latter. As with any other technical tool, it is advisable to combine it with other indicators for precision and reducing risks of false signals.
You can access the Inversion Bollinger indicator on Olymp Trade as an Expert status feature or by purchasing it on the Market. Either way, it’s worth trying out!
Trade on Olymp TradeRisk warning: The contents of this article do not constitute investment advice, and you bear sole responsibility for your trading activity and/or trading results.